Add your feed to SetSticker.com! Promote your sites and attract more customers. It costs only 100 EUROS per YEAR.
Pleasant surprises on every page! Discover new articles, displayed randomly throughout the site. Interesting content, always a click away
UKG People Analytics – Cognos BI – Explaining Cardinality for Left Outer Joins 15 Oct 2024, 2:35 pm
If you’re like me, you may find cardinality settings in UKG Cognos BI aka People Analytics less than intuitive. Even if you can do a SQL left outer join in your sleep. This post should help. It will help answer key reporting challenges, including:
Show me all active employees and their medical plans.
Show me all active employees and their highest level of education.
Show me all active employees and any bonus they received in March.
In each case, an active employee may not have any of the related data. An employee may not have a degree, a benefit plan or a bonus just because they’re getting a paycheck.
But, from a reporting perspective, you want to include all employees in each report. In SQL, these are all cases of “Left Outer Joins”. Many of the UKG People Analytics reports need this technique.
I’ll go through this step by step. The example combines employee and education data.
The first example will only include the highest level of education obtained by each employee.
Next, we’ll change the example to show all education levels. The number of records will change but the number of distinct employees won’t change. We’ll show you how to use Excel to prove that the number of employees doesn’t change. (There are ways of checking this within People Analytics/Cognos BI but this post was already quite long. I’ll be updating this with a link to another post.
Please note: This post is for you if you’re a report writer looking for results. If you want to dive into the deep meaning of cardinality, this post is not for you.
The Example – Employees and Their Highest Education Level.
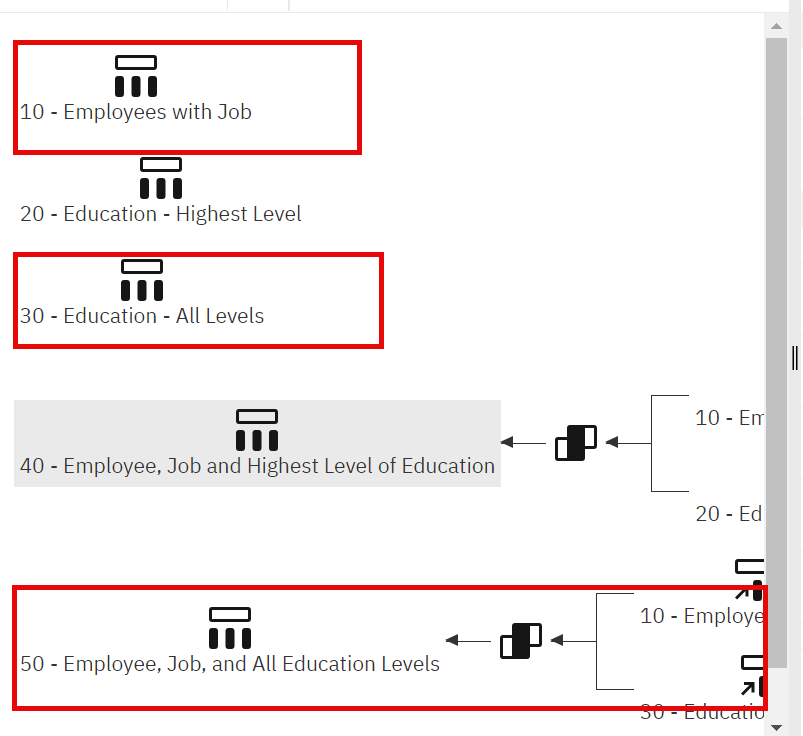
My sample report has two base queries and a third query which joins those two together.
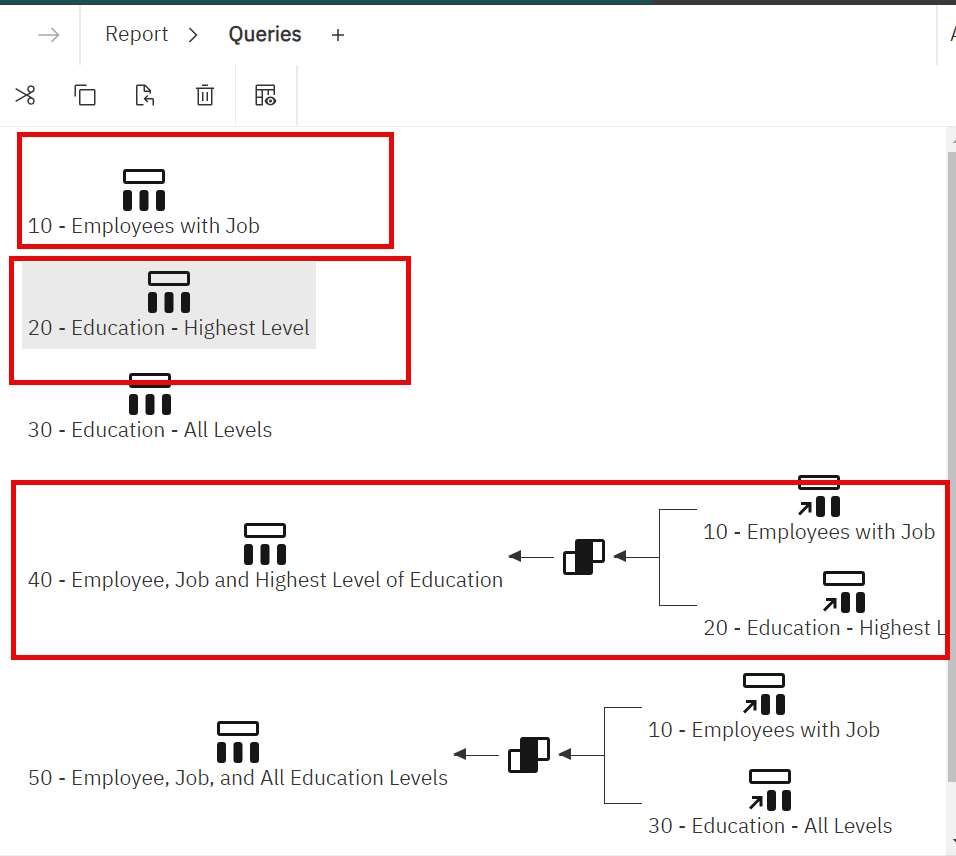
The base queries are:
10 – Employee with Job.
20 – Education – Highest Level
I then join these two queries in a third query:
40 – Employee, Job and Highest Level of Education.
I’ve numbered the queries for ease of reference in the output examples.
Each query only has one record per employee.
Let’s review the two queries
10 – Employees with Job
There are two things to note:
- I filter for active employees.
- I include EEID or Employee ID in the query.
Employee Numbers are unique WITHIN companies but not across multiple companies. EEIDs are always unique across all your companies. This will allow us to create our link on a single column.
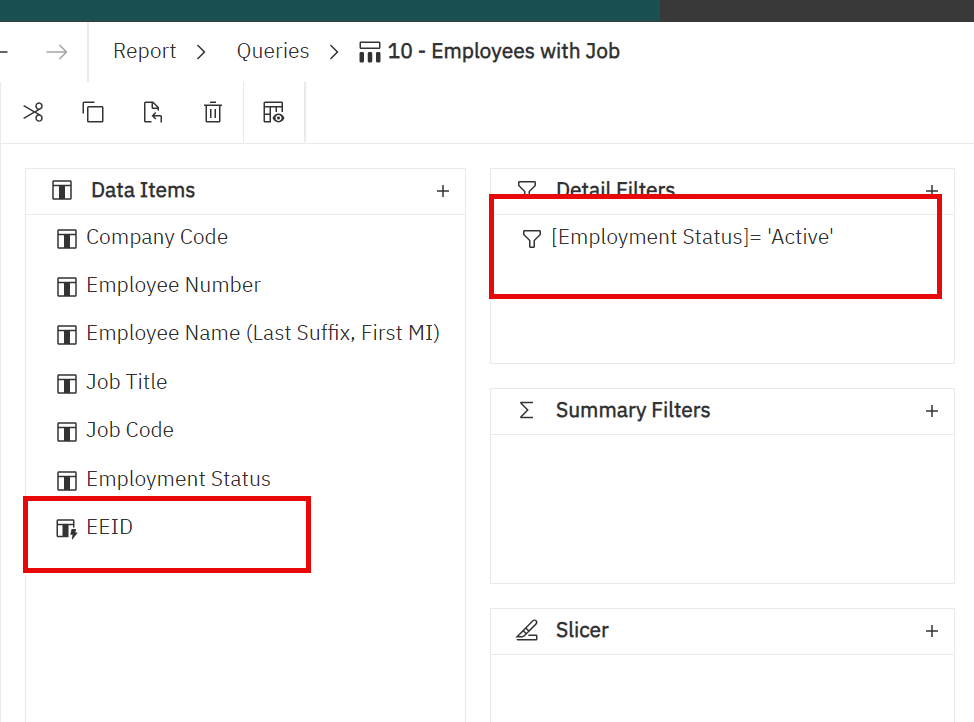
When I run this query, we receive 2047 records back.
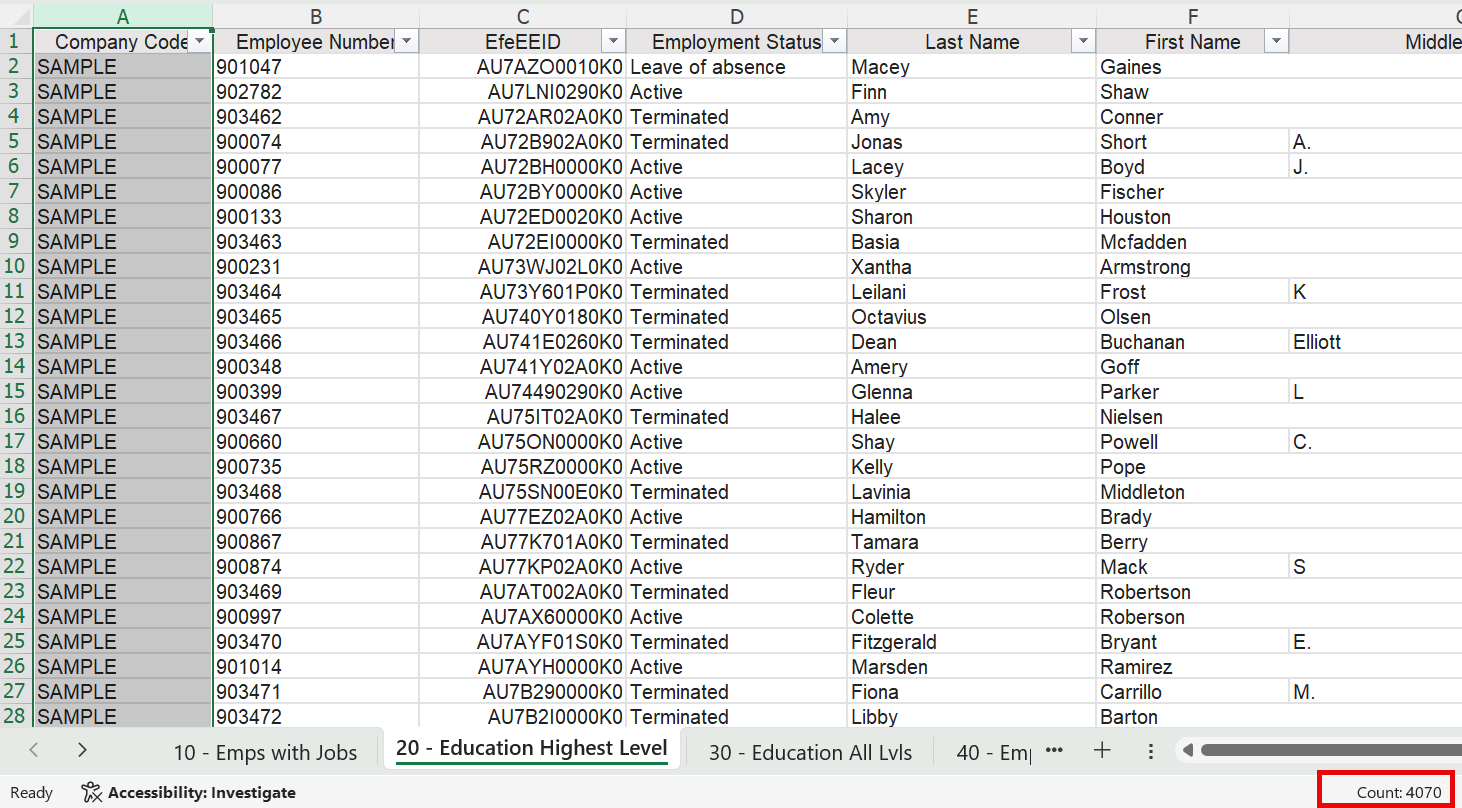
20 – Education – Highest Level
I’ve filtered this query to deliver one record per employee by selecting the highest level. (As far as I’ve seen, there can only be one highest level. Of course, if someone had two PhDs, I’m not sure which we would be the highest. It’s nice to know that after all that education, the individual found employment. But I digress.)
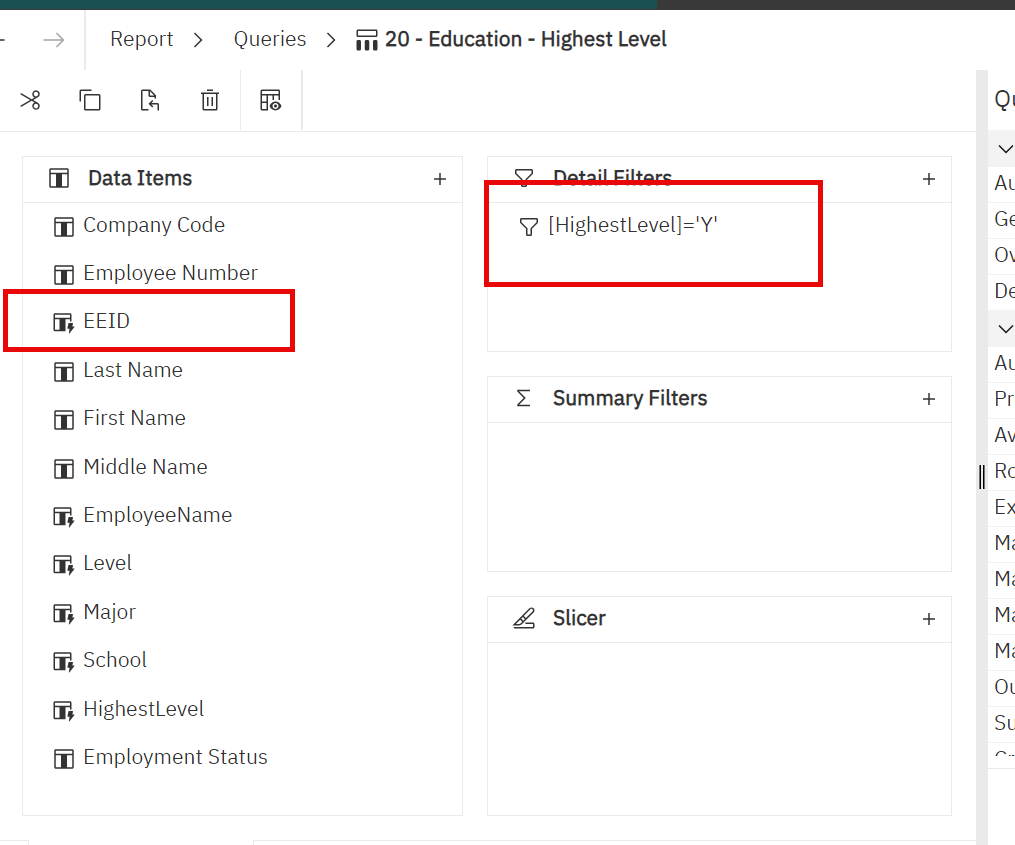
This query delivers 4069 records back.
You may ask yourself: How did I get here? –Why are there more records in this result than in the first query?
The answer: We didn’t filter this for active employees only. Because of our cardinality settings,this won’t matter.
Your mileage may vary depending on your data.
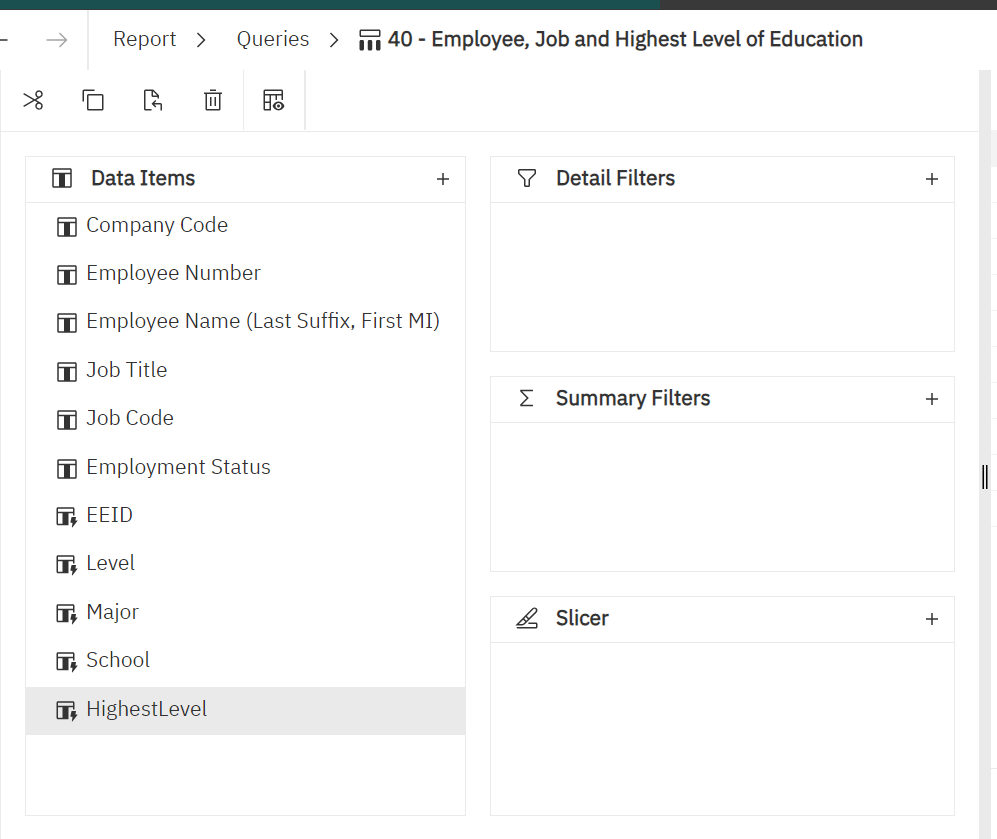
40 – Employees, Job and Highest Level of education
Now, I combine the two queries into the final query.
Let’s look at the join:
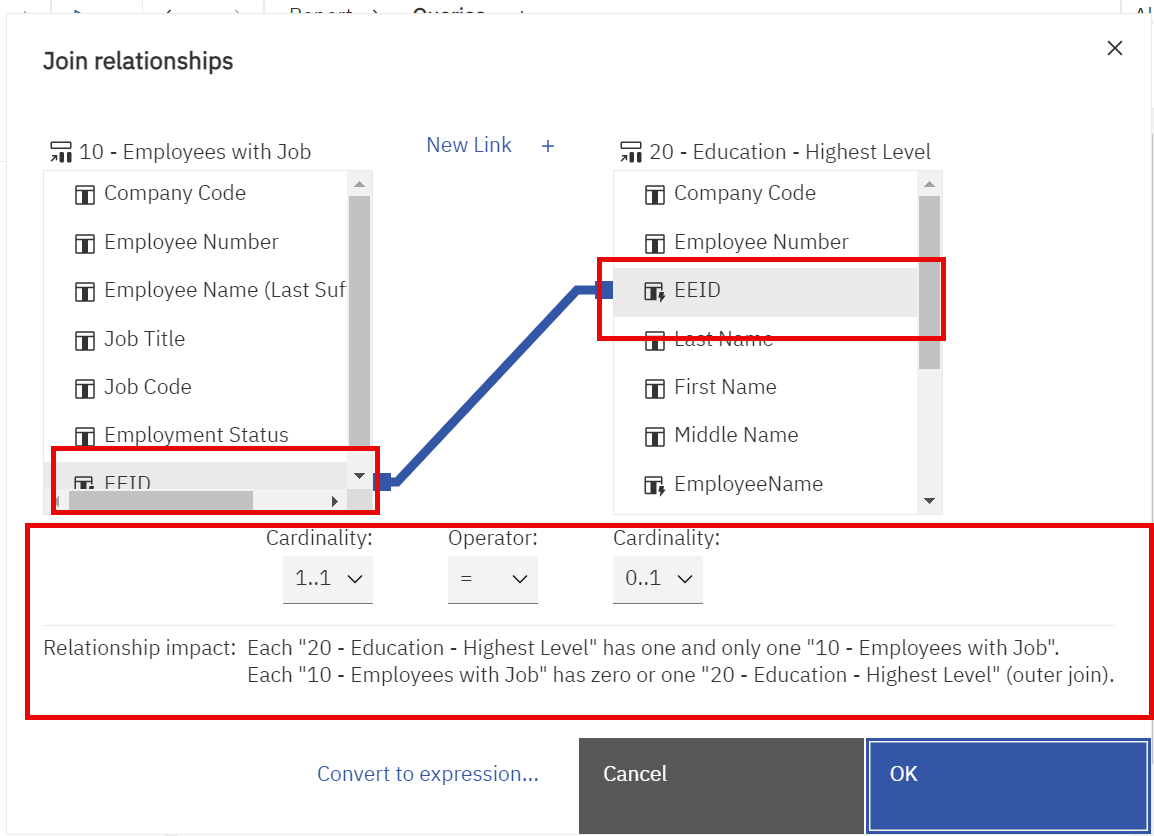
Let’s review the cardinality settings.
Let’s start with the Left side – 10 – Employees with Job. The 1:1 Cardinality setting means that we expect every record in the 10 – Employee with Job query to appear in the final, joined query. For most purposes, including the cases mentioned above, you will ALWAYS set this value to 1..1.
Now, let’s review the right side – 20 – Education – Highest Level. The 0..1 setting means that the join query may or may not include any education information. And, for each employee there can be no more than 1 education record.
For reference, here are the fields in the joined query:
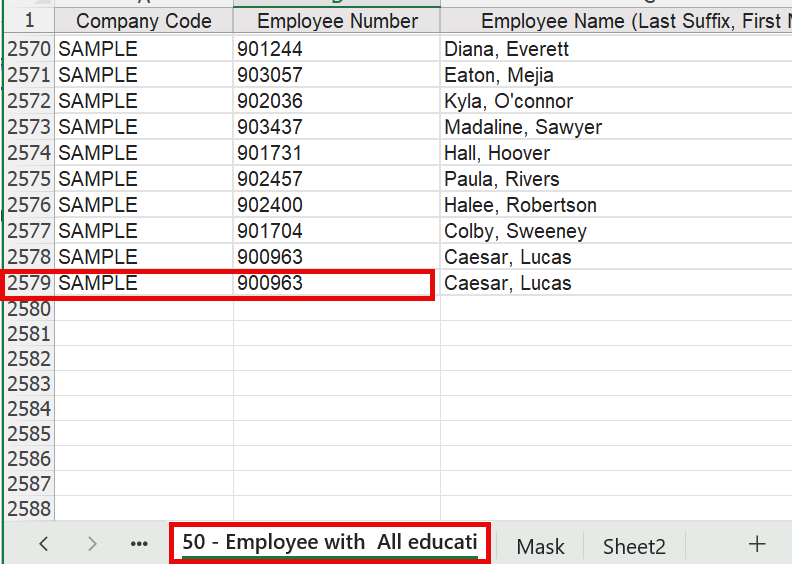
Let’s run the query to excel. You’ll see that the number of records matches the number of records in the 10 – Employees with Jobs. Not all employees have a highest level of education specified. You’ll also see that not all employees have education information.
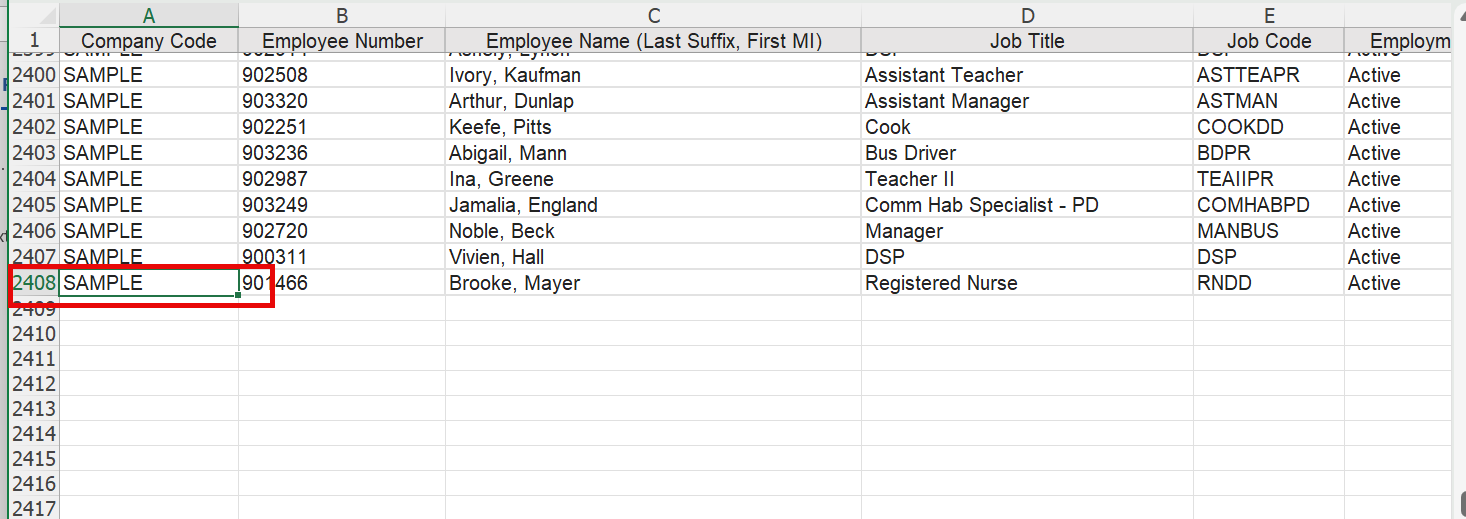
And you’ll see that not all employees have education information.
Let’s now adjust our query so we can see all education levels.
Employees – All Levels of Education
Here are the queries we’ll be using:
I’ll still be using 10 – Employees with Job as our base query so I won’t review that again.
I’ve made slight adjustments to the other queries.
30 – Education – All Levels
For this query, we’ve removed the filter on “highest level”. We can expect to receive multiple education records for some, but not all employees.
50 – Employee, Job and All Education Levels
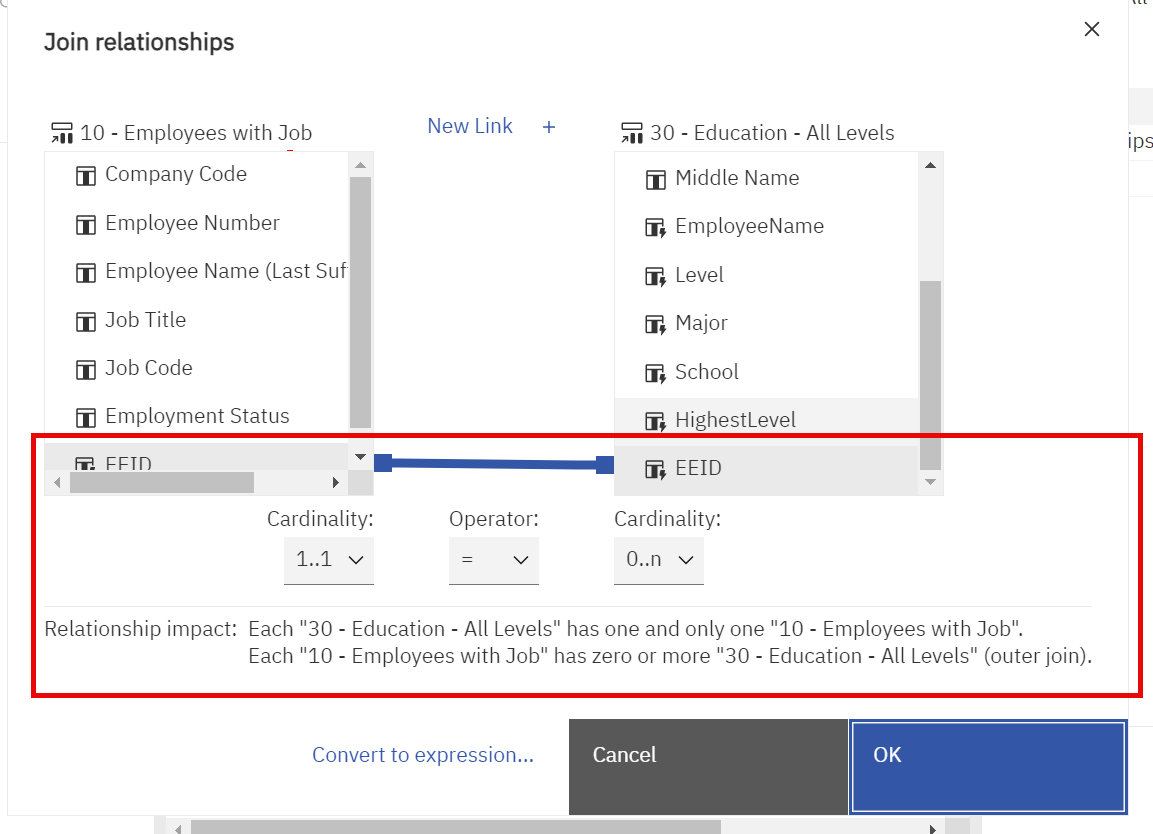
We are still joining on EEID.
The cardinality under 10 – Employees with Job is still 1..1. Again, this is almost always the setting you want.
On the right side, I’ve adjusted the cardinality to 0..n. This tells us that for each 10 – Employees with Job record the joined query may have 0, 1 or multiple records from 30 – Education – All Levels query.
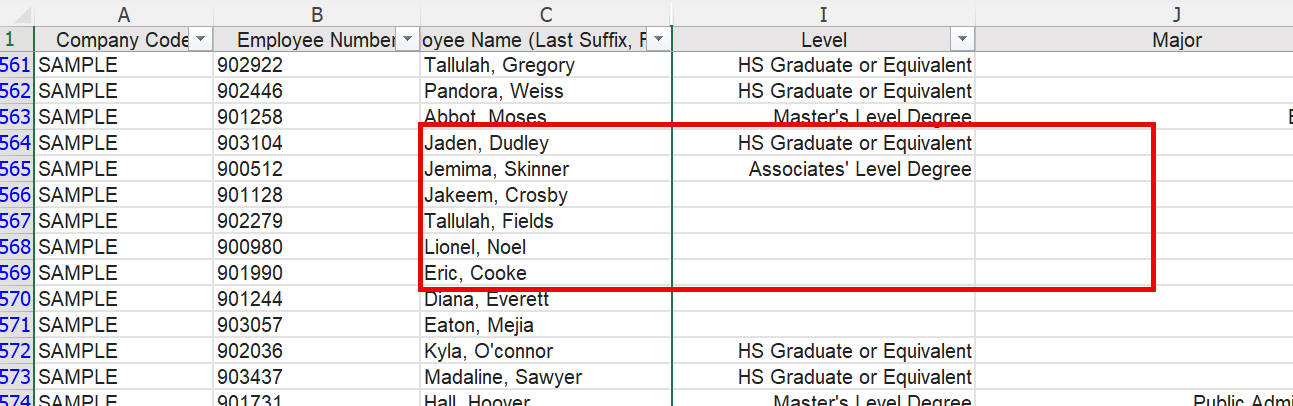
As expected, we get more records—in this case, 2578.
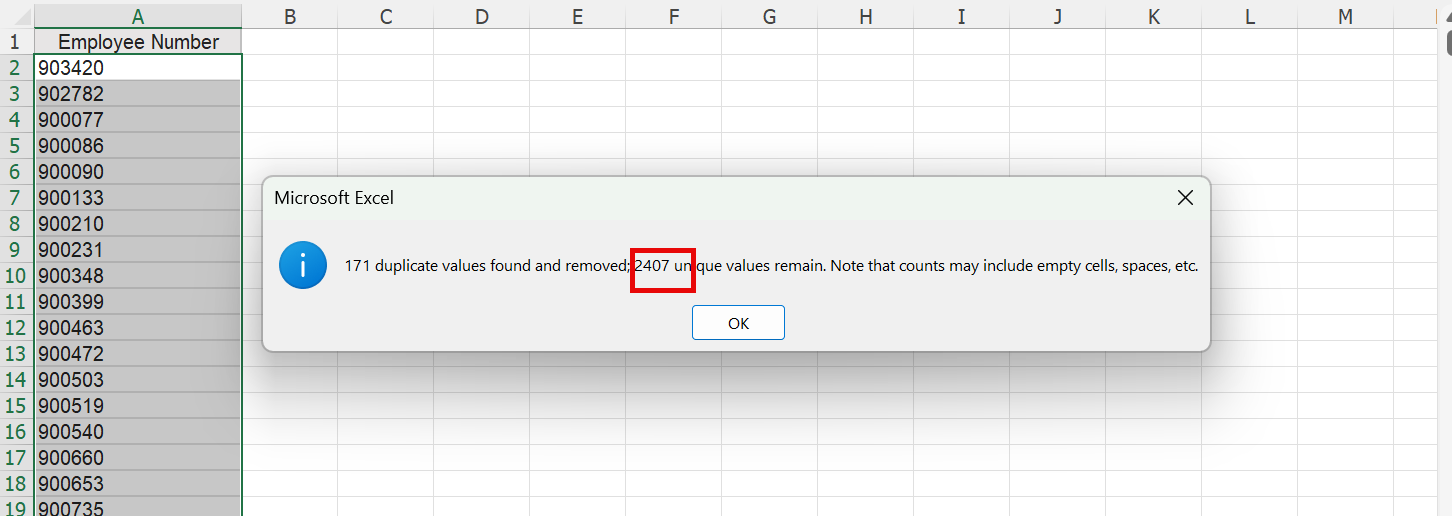
As a simple check that we are still getting the same number of employees, we can use Excel.
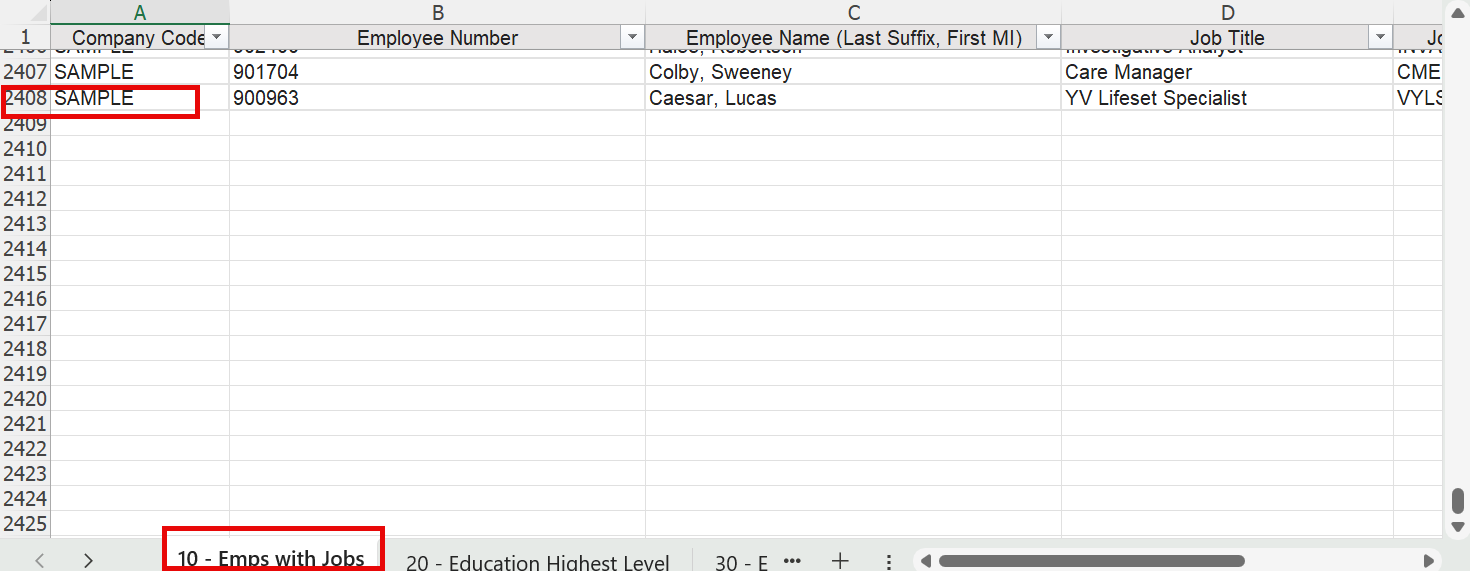
We copy the column of employees to another sheet and remove duplicates. We get 2407.
Let us know if you have questions below. If you’d like the sample report, please contact us.
The post UKG People Analytics – Cognos BI – Explaining Cardinality for Left Outer Joins appeared first on Red Three Consulting.
Implementing UKG Onboarding 26 Sep 2024, 3:31 pm
Implementing software is like meeting someone IRL after swiping right on their profile.
You don’t always get what you expect
I’m helping a customer plan their implementations of UKG Onboarding and UKG Document Manager. Document Manager is straightforward and does what’s expected. Onboarding is a fine solution for many customers. But is not as flexible as they expected. Or as the sales team may have implied.*
While we went into a great deal of detail, here are some basic impressions for what it does/doesn’t do well.
The good:
1) It’s covers the basics The system can collect the data you need to get the data you need for compliance. It doesn’t matter whether your employees flip burgers or provide therapy. The system will collect all the basics– from bank accounts to i-9s.
2) You can add an almost limitless number of documents I’ve worked for myself for decades. But I am aware how many documents people sign when they work for a company. If you have a document, you can add it. And you can interface it into document manager.
The other:
1) You can’t collect custom data. Or you can, but the data stays in the pdf documents you create. So, if you create a customer field for the new hire to fill in, they can do it. But you can’t extract that data into a report.
2) Provisioning is rudimentary If the new hire needs a laptop or a card key, you can send an email to the appropriate department. But that’s about it. Sending emails was exciting the first time we used workflow years ago. It’s not exciting now.
3) If you have other key systems, you’ll need to find a way to bring them together. The system has basic integration to applicant tracking systems (like Greenhouse and iCims). But it’s not early as open as the other parts of HRSD. This is where things aren’t the same for the burger flipper and the physical therapist. Onboarding health care professsionals takes quite a bit of information. And having that data in PDFs doesn’t really work.
What’s your experience with onboarding?
If you’d like it to work better, let’s talk.
*They recorded their kickoff meeting with UKG. It helped me understand where they got certain ideas. I did sales once too.
The post Implementing UKG Onboarding appeared first on Red Three Consulting.
Better UKG Setup delivers better data 26 Sep 2024, 2:23 pm
We’re data focused. It’s what we do better than almost all the other UKG consultants we’ve met.
But too often, it’s hard to get the right answer. No matter which API or reporting tool you choose. You need to perform the data double backflip with a twist. With your eyes closed.
Because the setup isn’t right.
Why?
Because like any large, complex system UKG Pro and UKG Pro WFM need to support three things:
Transactions, Analyses and Audits.
Transactions – You need to do something to keep the business running right now. In our case, that means recording time and paying employees. Any implementation that go lives will get this done or the business will close. If you can’t pay your people, they aren’t going to hang around.
Analyses – You need to understand what happened when you review your data a day, a week, a month, or a year later. Moreover, answering most questions shouldn’t need special knowledge of your rules. Here’s a good test. You hire a new report developer, whether as an employee or as a consultant. This person knows UKG People Anlaytics. How many times do you need to say, “sorry, I forgot to tell you.” Or “sorry, that only happened once. That we remember”.
Audit – Your data needs to be self-explanatory. No audit is fun. But convoluted explanations make audits worse.
Here’s a simple example. A certain client didn’t enter employee transfers in a timely fashion. (I’m sure this doesn’t happen at your organization. But pretend for the sake of the example).
The employee gets paid. But all the org level and/or job information isn’t right.
The correction shows up in weeks or months later. So, they make the appropriate change.
But they use the same earnings codes they use for a regular payroll. So, the numbers balance for the company. But departmental analysis shows some strange numbers. A department with $100K monthly budget shows a $250,000 month. Year to Date all is correct. But the month is crazy.
Of course, a little analysis means it’s not hard to figure out what happened. But separate adjustment earnings codes would make it obvious.
This is a simple example. Using different codes is even more useful when you want a different G/L treatment. Because it’s a pain to reconcile Payroll vs G/L when there are ALWAYS adjusting entries.
Why does this happen? Because too often the consultant or the team was under pressure. And they wanted to get the transaction done now.
But the right answer isn’t always the fastest answer.
Which is why we help folks adjust their setup so it’s easy to get the answers out of their systems.
Without doing a double reverse backflip with a twist.
If your data analysis is much harder than it needs to be, let’s talk.
The post Better UKG Setup delivers better data appeared first on Red Three Consulting.
Reducing Overtime with UKG Pro WFM 11 Jul 2024, 1:44 pm
Companies implement Advanced Scheduler in UKG Pro WFM to control overtime.
But having the system isn’t enough. Payroll told you THAT you had overtime. Now, you want to know why. Where to start?
Here are some key metrics we’ve developed to help you drive overtime down.
- Worked vs Scheduled:
You know someone’s schedule. You know each day how much they worked.
you schedule Joe for eight hours on Monday. He worked twelve. There’s a good chance he’ll be receive overtime by the end of the week. - Early in/late out.
Yes, employees have grace periods. But some folks are consistently 14 minutes early and 14 minutes late out. Do that five days in a row and you have 2.5 hours a week. That adds up. - Working but not Scheduled
Getting folks scheduled is the cornerstone of successful management. Lots of unscheduled time points to process issues. The systems not helpful if you have lots of unscheduled time. - Hours entered without swiping
Time keeping devices aren’t perfect. But they are consistent. When some folks are consistently worse at swiping in than others, you have a problem. - Short Staffing
It’s sad when folks try to cut overtime when they’re short staffed. Position control, applicant tracking and open shifts in Advanced scheduler identify this problem. And if you have it, advanced scheduler can help, but it won’t solve your underlying problem.
These are just some things our clients have found useful. What have you used to get your overtime down?
The post Reducing Overtime with UKG Pro WFM appeared first on Red Three Consulting.
California Meal and Rest Breaks in UKG Pro WFM 5 Jun 2024, 3:11 pm
In California if a person doesn’t take a break after five hours, they receive extra pay. Unless they attest that it was their choice to skip the meal. A similar rule applies for rest breaks.
UKG has standard functionality to handle this but it’s not straightforward. Our client had an added challenge. Some of their employees use a different system to enter time and attestations. that data needed to be interfaced.
I thought about writing up the entire process in detail. But it’s just too much for a blog post. Here are some key lessons learned:
- There are many ways to create the pay code edit for the penalty. You can use:
- A bonus rule attached to a work rule attached to the pay rule for the employee.
- An Attestation workflow
- A Boomi Extension.
Choose one so you don’t get more entries than you expect.
- If the meal break pay code is created automatically, you may want to cancel it. You can do this:
- With an Attestation workflow. The pay code edit will show as cancelled in the timecard. Users may be confused.
- With an API to delete the pay code edit.
- Just because the process works on the screen, DOESN’T mean it will work when called via the API.
We had an issue where the attestation button created a pay code when the button was used from the tile on the user’s home page.
It didn’t work when the same button was “punched” via API. Support provided additional code to resolve the issue.
You can’t understand an API unless you understand the system. If you want help bridging the API/Application gap, contact us.
The post California Meal and Rest Breaks in UKG Pro WFM appeared first on Red Three Consulting.
UKG Pro and UKG Pro WFM Posts 10 Apr 2024, 1:02 pm
Here’s a list of all our UKG Pro related posts. Let us know if you have questions or other topics you’d like to see covered.
UKG Data Integration
- UKG Pro
- UKG Pro WFM
Data Warehouse – Power BI/Other Tools
- UKG Pro
UKG Reporting
- People Analytics – Cognos BI
- UKG Pro WFM
The post UKG Pro and UKG Pro WFM Posts appeared first on Red Three Consulting.
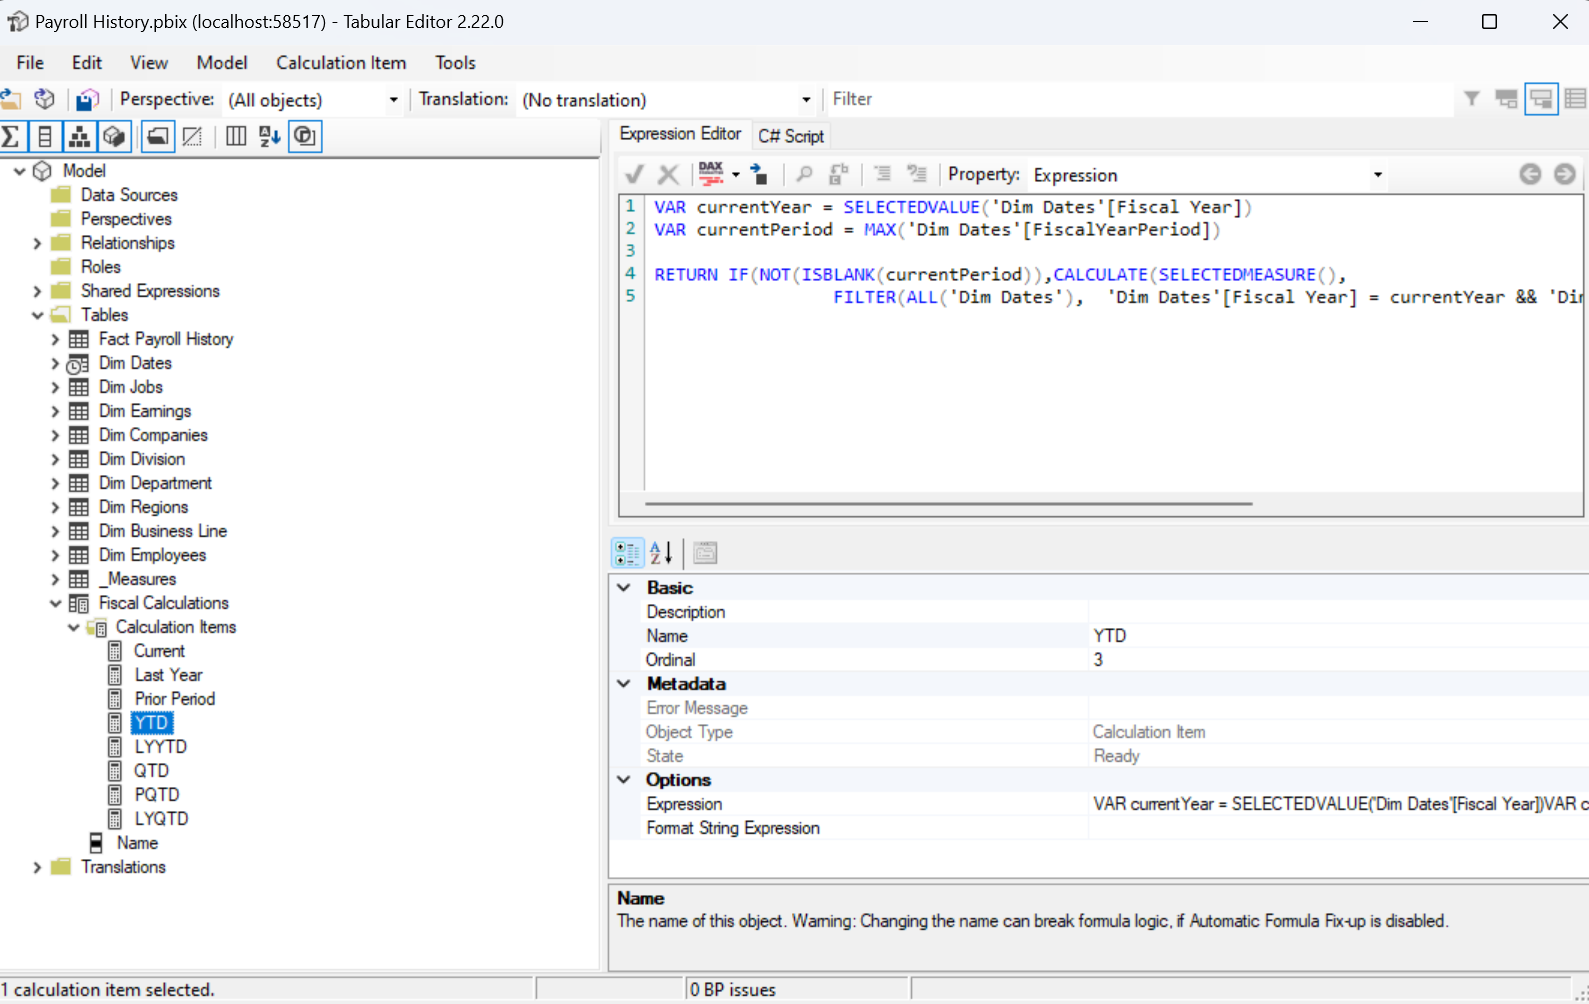
Power BI and UKG Pro 4 Apr 2024, 10:55 am
You’re here because you want to use Power BI with UKG Pro Data.
You’re not the only one. Here’s a solution that might interest you.
The solution comes with all the code you need to run reports in UKG People Analytics and have the data show up in Power BI. The Power BI model has measure based on payroll amounts and hours. We’ll be adding head count statistics shortly. All the basics are included – like Job and org Level information.
So, let’s point out a few key things for business users and technical folks:
For business users:
- This works on a fiscal year, not a calendar year. You can do analysis by Payroll Cycle. But if you want to share data across the organization, the solution will perform detail accruals and reversals so that these reports tie to your fiscal periods.
- A variety of period logic is built in, including:
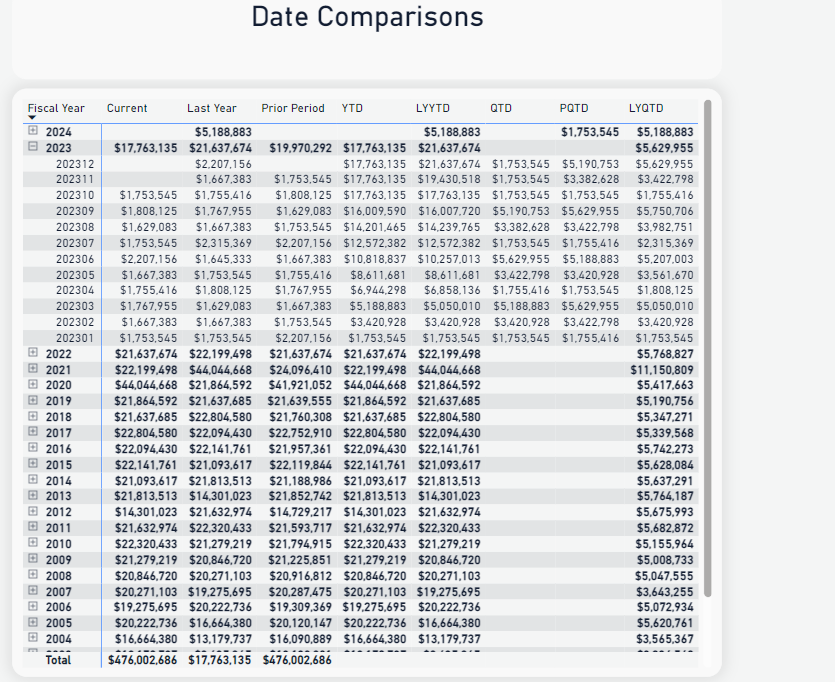
Current Period, Last Year Current Period, Prior Period, Year To Date, Last Year Year To Date, Quarter To Date, Prior Quarter to Date, Last Year Quarter To Date. This date logic applies to hours and amounts for regular and overtime. It can also apply to any other new items you decide to measure.
For technical folks:
- The solutions uses:
PowerShell or Python to run Reports as a Service.
SQL Server
PowerBI - The solution is designed for “on-premise” technologies running in virtual machines. We’re building a full, serverless cloud solution.
- We transform data in SQL before loading into Power BI. This means that we can use the data for other solutions – not just Power BI.
- We use calculation groups, parameters and a measures table in Power BI to make the code as easy to support and extend as possible.
Here’s a video of the Power BI model.
And below is more detail of each part of the solution:
People Analytics Reports – Cognos BI
People Analytics Reports – Cognos BI
We’ve created six reports for the sample.
These four reports are designed to completely refresh the data every time they run:
DW – Company Codes
DW- Earnings Codes
DW – Jobs
DW – Org Levels
These two reports will run for the previous two weeks. This can be adjusted to your requirements. When we set up the initial load with you, we’ll provide versions that can be run for longer periods to load the data.
DW – Employee Job History
DW – Payroll History
The reports are designed for use in Reports as Service – no fancy formatting involved. Here are screen shots of what each report provides with some additional information.
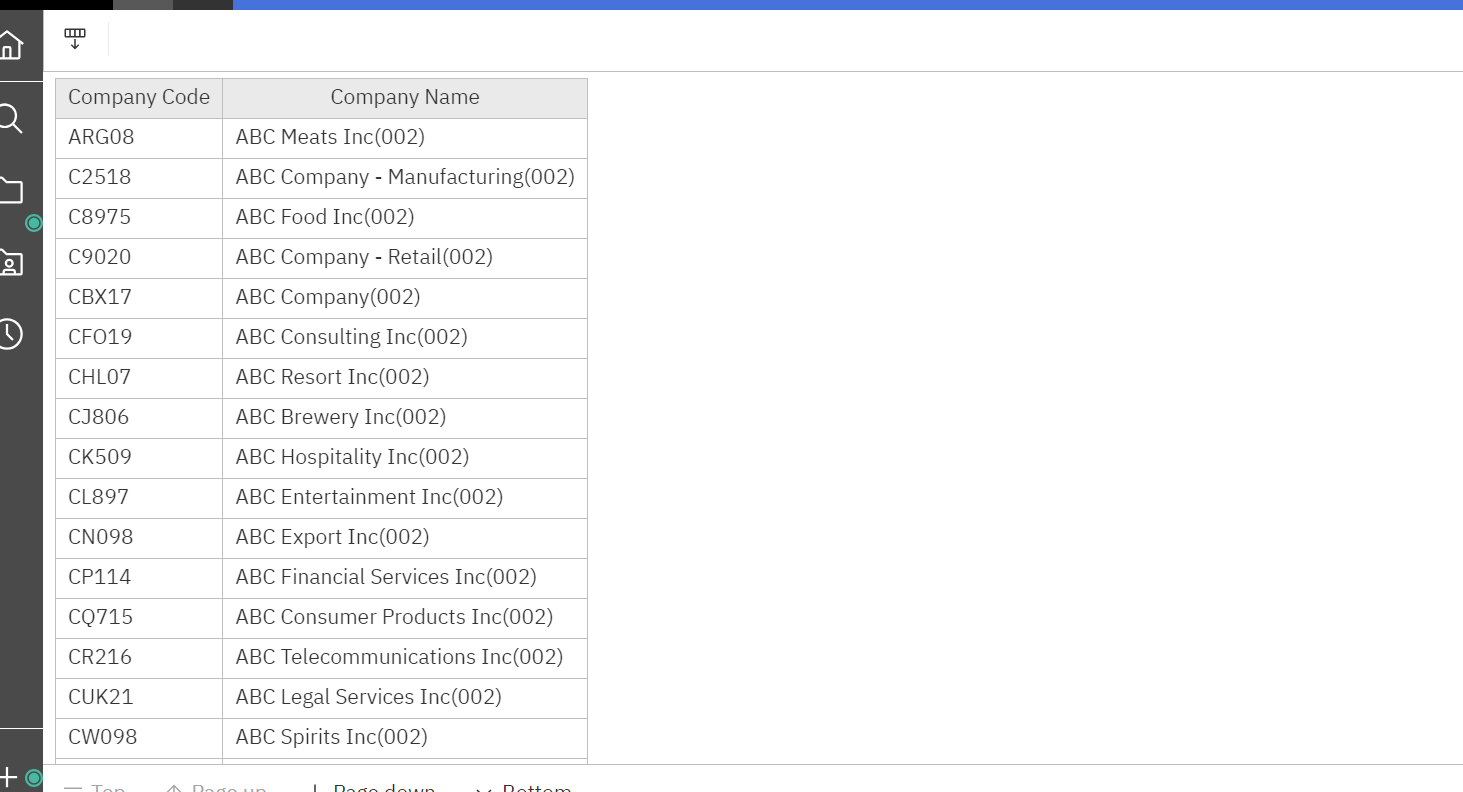
DW – Company Codes
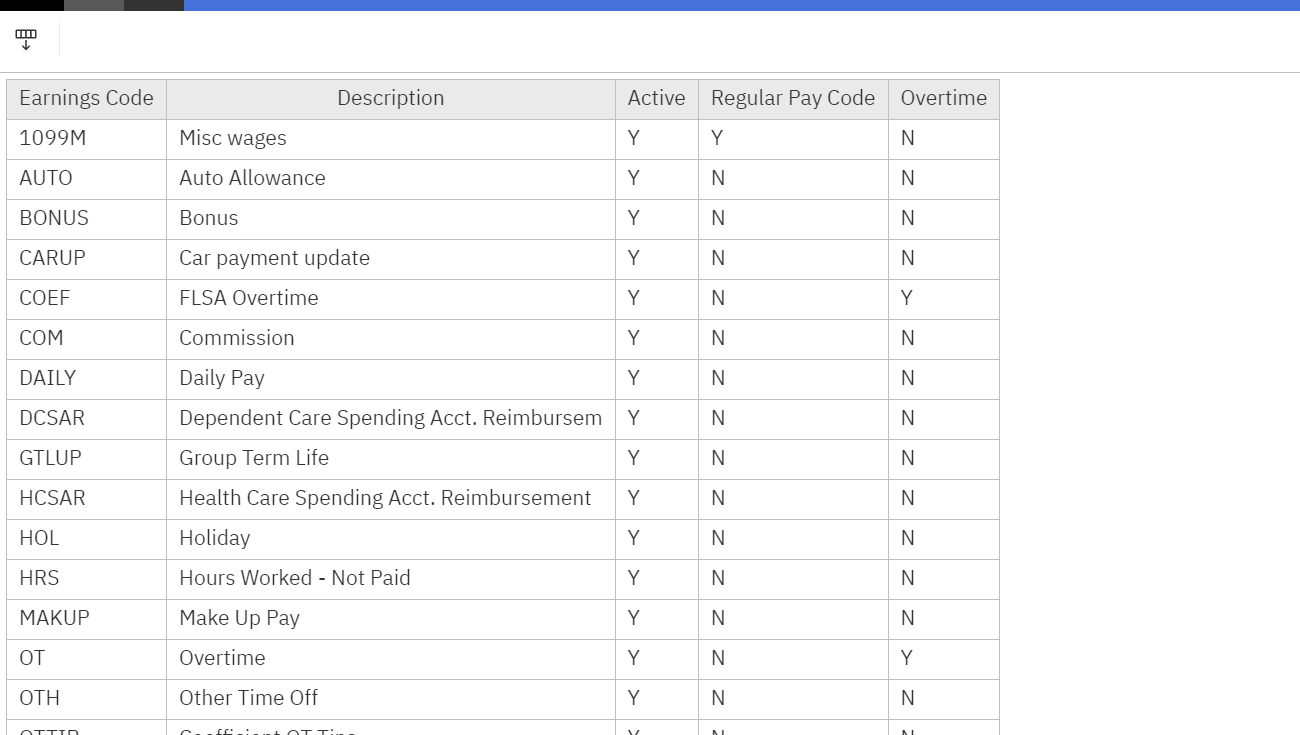
DW – Earnings Codes
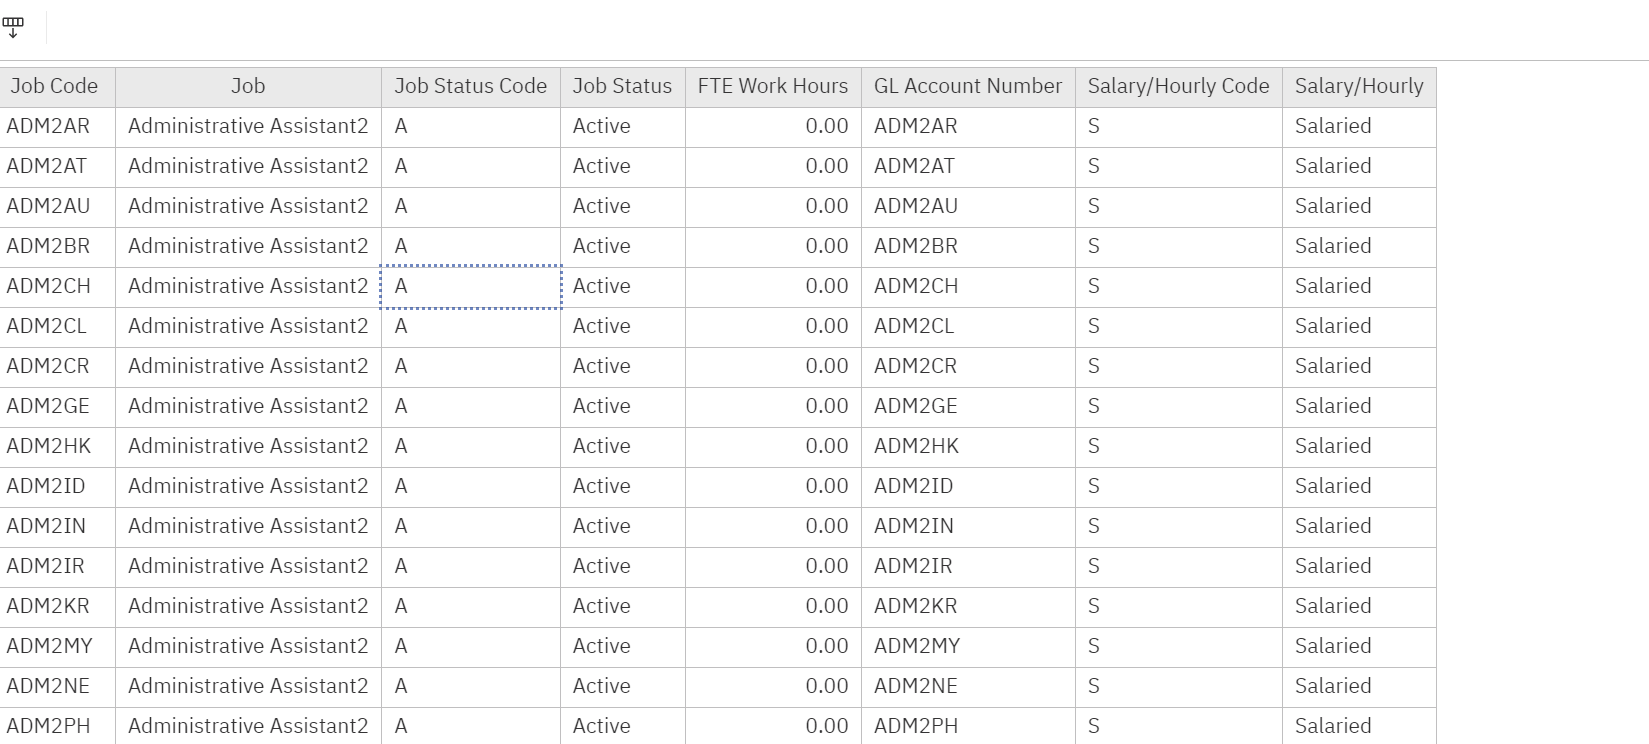
DW – Jobs
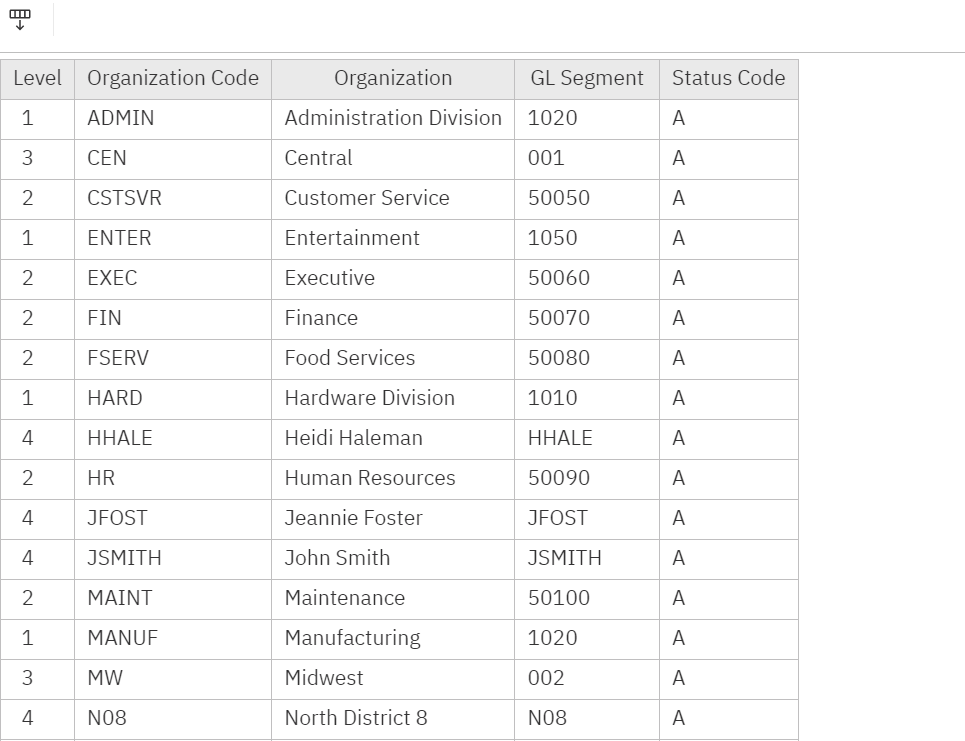
DW – Org levels
You’ll see that we include all org Levels in one report. In the data model, we break this one table into four separate dimensions. You can see that in the data model later in the post.
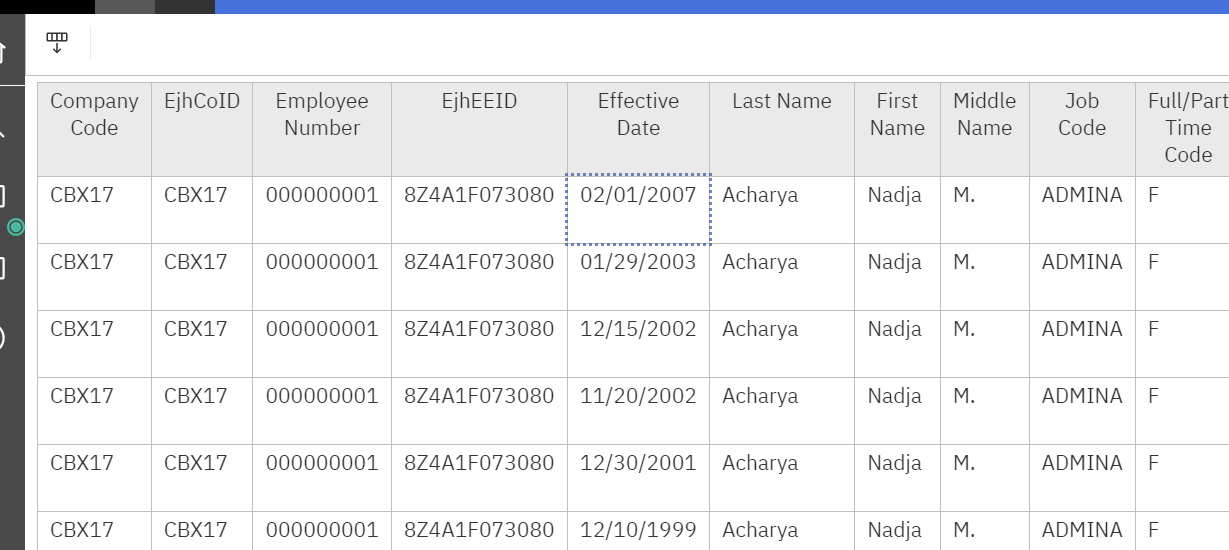
DW – Employee Job History
Each Employee Job History Record shows information for Job, Full/Part time, Org Levels and Pay Rates. We perform several transformations in SQL to create slow changing dimensions and to eliminate duplicates when multiple changes were made retroactive to the same data. We discuss the challenges with this data in this post.
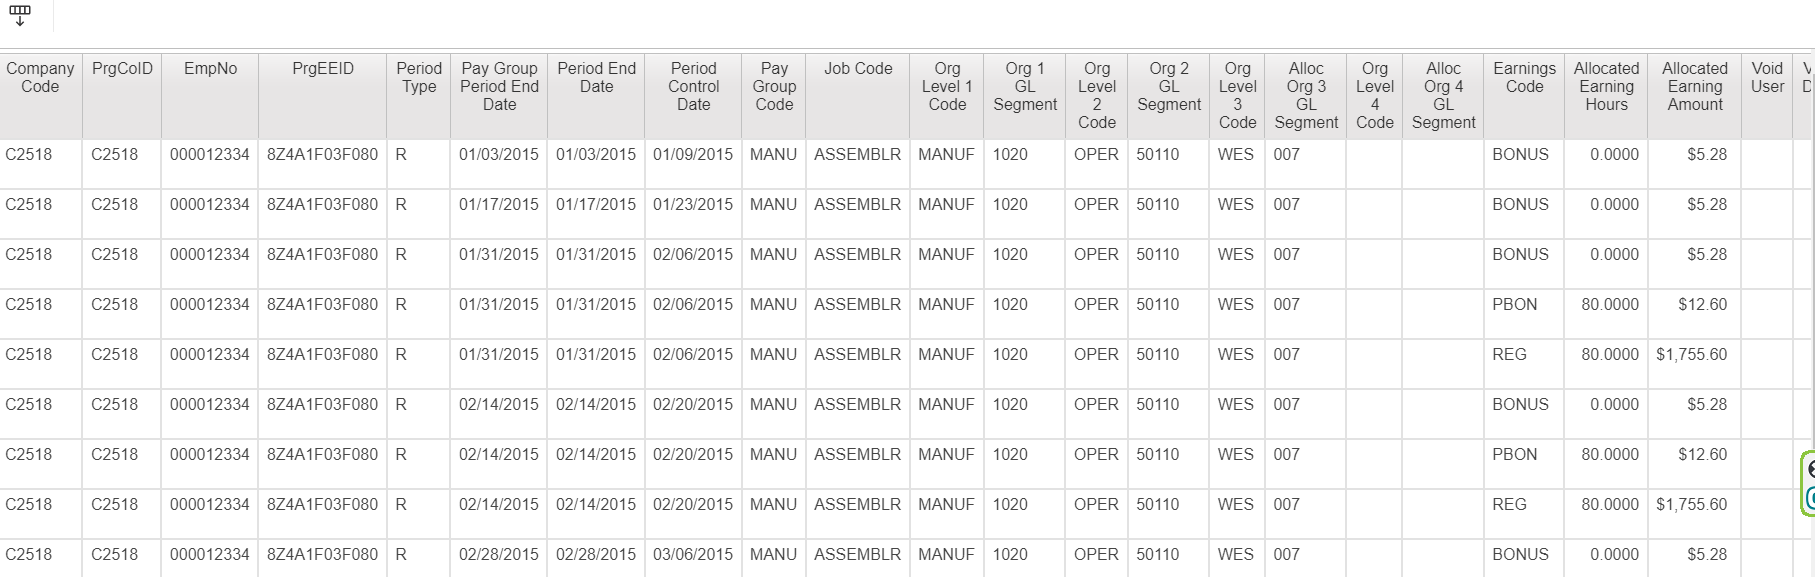
DW – Payroll History
All org levels are included – as well as basic job information.
Using Reports as a Service
We go into detail about Reports as A Service here and why we prefer it for data warehouse integration.
We’ve built versions of our wrapper code in both Python and PowerShell.
SQL Database Features
We prefer having a SQL Database for several reasons:
- Power BI is not the only tool that needs the data
HR Payroll Data gets sent to many different places. Having it in SQL means it can be used for multiple purposes – not just analytics. - We agree fully with Roche’s Maxim – data should be transformed as far upstream as possible and as far downstream as necessary.
- Adding functionality is easier in SQL. We mentioned above that we have code to accrue your payroll data to match your fiscal periods. We’ve done that in SQL.
Without diving deeply into the technical weeds, you’ll see several tables that aren’t just places to store the report data.
Dbo.etlReportsCtl is a control table. This allows us to add more data from UKG to SQL without writing additional stored procedures.
Dbo.EmployeeJobHistoryFinal takes care of the duplicate change problems we discussed above.
The three SCD tables – dbo.SCDJob, dbo.SCDOrgLevels and dbo.SCDPay are “slow changing dimensions”. These tables allow us to answer questions of turnover, transfers and pay changes within given periods.

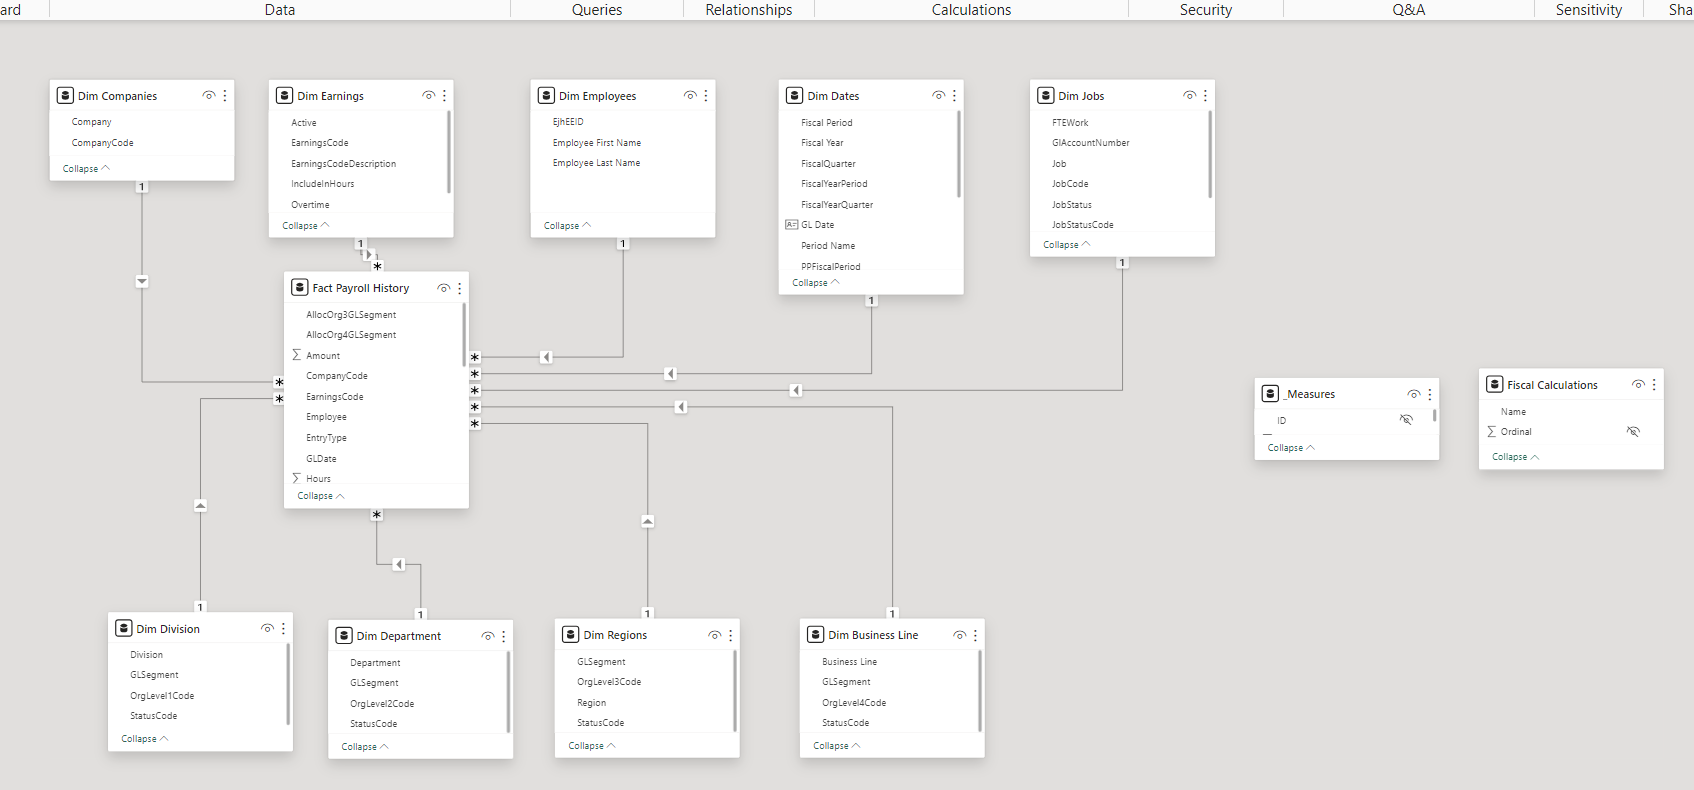
The Power BI Model
We have a video preview of Power BI here.
Before we start, let’s acknowledge that EVERY SINGLE PERSON reading this blog post will have a different idea of what should go onto a PowerBI page.
We’re here to deliver the data and build the model. We really think it’s best if in-house folks make it “pixel perfect” for their teams.
That said, here’s the basic layout- with key measures like Overtime, a full selection of companies years, org levels, and job titles.
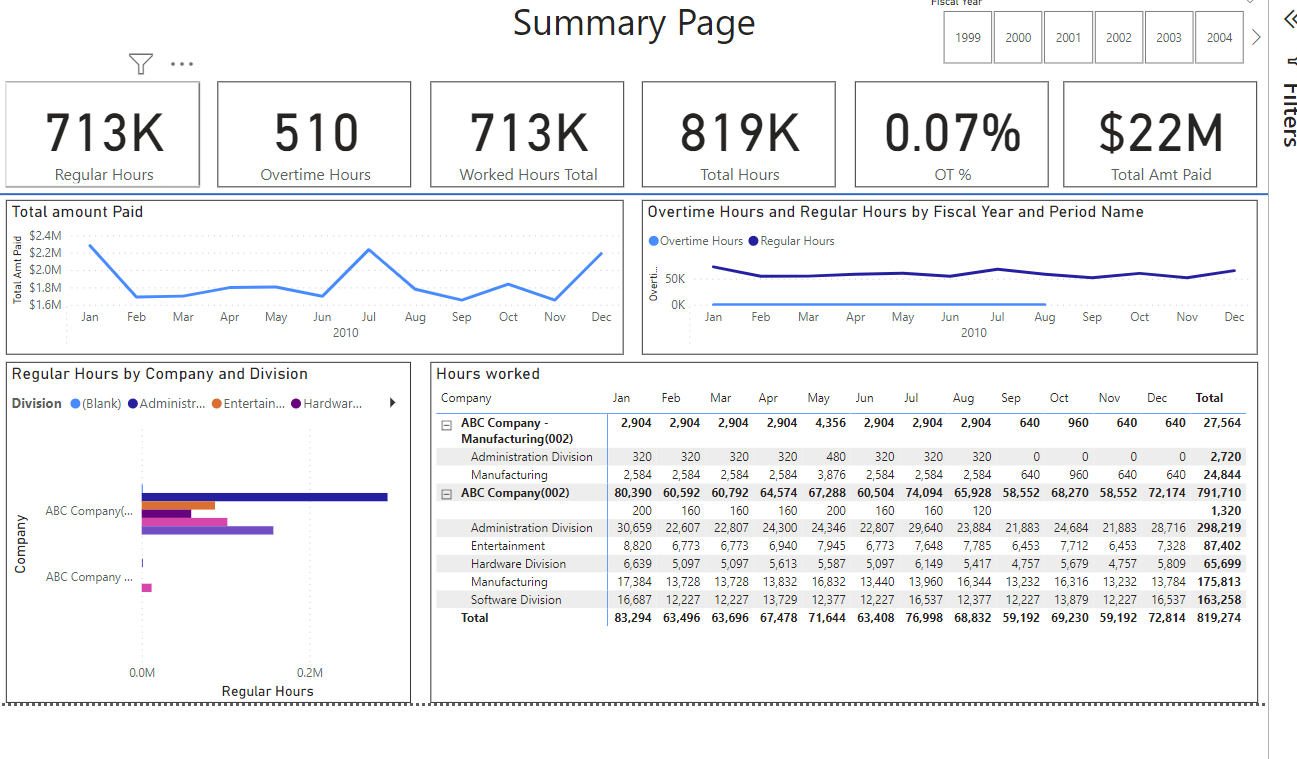
Looking at the model, you’ll see all expected tables – including a separate one for each org level. There’s also a date table (built in SQL) and a measure table (which is Power BI best practice)
We’ve included many different date calculations as we mentioned above, including: Current Period, Last Year Current Period, Prior Period, Year To Date, Last Year Year To Date, Quarter To Date, Prior Quarter to Date, Last Year Quarter To Date.
On a technical note, all the measures are built with calculation groups based on Fiscal Year/Period logic. This makes is easy to add more measures across the date ranges:
We can provide the full example – including Cognos Reports, PowerShell, SQL, and Power BI code for 15,000. If you’re interested, contact us.
The post Power BI and UKG Pro appeared first on Red Three Consulting.
Connecting UKG Pro Employee Job History to your Data Warehouse 30 Oct 2023, 12:28 pm
Our last post discussed payroll history challenges and your data warehouse.
Today, you’ll learn about challenges involving Employee Job History
You know that it’s not enough to know what your job counts and job titles are today. You need to know what they were last month, last quarter, and last year.
This data presents several key challenges:
- Changes made after the effective date.
UKG Pro allows you to back date employee job changes. For example, Jill was promoted on July 1st, but Jack forgot to enter the promotion until August 1st. This creates two issues. First, your headcount has changed. So, reports issued as of July 1st are now incorrect. Next, you paid Jill as a manager even though she was a VP through July. So, you’ll need to make a journal entry or payroll adjustment. These adjustments will complicate your data warehouse. There is no technical solution to this problem. Your team needs to track back dated changes and fix the poor processes that create them.
- Multiple changes made on the same effective date.
Let’s say that Jack wasn’t a total slacker. He changed Jill’s title on Time. But he forgot to change the department. So, he makes another change, also effective July 1st. You’ll now find two job changes on the same effective date. When you create your data warehouse, you only want to look at the last change made. - Your data warehouse expects a star schema and slowly changing dimensions.
A standard data warehouse will expect several slowly changing dimensions for employee data. For example, title, organization levels, annual salary and supervisor. Employee Job History doesn’t provide this. Instead, it gives you the values for all those fields on a given date. It won’t tell you which field changed on that date. You need to compare records to see what actually changed.
Our basic data warehouse addresses these issues. We can also train your team in how to work with these challenges. If you’d like to discuss these options, contact us.
The post Connecting UKG Pro Employee Job History to your Data Warehouse appeared first on Red Three Consulting.
Connecting UKG Pro to your Data Warehouse – Payroll Detail. 27 Oct 2023, 4:45 pm
You want your UKG Pro data in your Data Warehouse. We’ve touched on why we -recommend reports as a service here. You’ll never pull all your UKG data into your data warehouse. It’s too large and too much of it is only important for HR, Benefits and other compliance purposes.
So, what should you put in your data warehouse?
The key starting points are Payroll Detail and Employee Job History.
Building the key reports isn’t hard. But that’s only the beginning.
You should keep the following tips in mind when you work with Payroll History:
- Focus on Dollars and Hours that represent compensation.
You shouldn’t worry about employer paid taxes or other employer contributions. Setup may not be right. And they aren’t within the control of a given employee’s manager. - Tie your data to your general ledger.
Sometimes pay cycles match accounting periods.
And sometimes they don’t. When that happens, your payroll numbers and your financial numbers won’t match.
That’s NOT good.
You need to understand your payroll accrual process. And create the logic within the database or data warehouse. - Late Job Changes will cause confusion
Jane was promoted July 1st. But John didn’t enter that until August 1st. So, Jane got paid in her old job for July.
And received a retroactive true up in August. You’ll need to address these issues. We’ll talk about these and other Employee Job History problems in our next post. - Keep your dates straight.
You want use the Pgp Period End Date from Payroll History Summer so you can tie to your ledger. There many other dates available but we’ll save that discussion for another day.
In our next post, we’ll talk about challenges with Employee Job History.
The post Connecting UKG Pro to your Data Warehouse – Payroll Detail. appeared first on Red Three Consulting.
UKG Pro – Reports as a Service vs Rest API 27 Jun 2023, 11:57 am
Why We Use Reports as a Service over Rest APIs with UKG Pro
You need to decide how to get your data from UKG Pro. We recommend Reports as a Service (RAAS) even as we also support Rest APIs. Here’s the data.
- It provides the most data
We’ve found all the data we need in People Analytics. While the API list is long, it’s not FULLY comprehensive. For example, the Employee Pay Statement shows everything the employee sees on their check. It doesn’t show Org Level Job allocations. If you do a lot of payroll analysis, this doesn’t work. If you’re like all my customers, you have at least SOME people that work in multiple departments and even in multiple jobs. If someone has found an API that provides this detail, please, please, please let me know I’m wrong. - RAAS leverages user knowledge.
There are plenty of folks who know how to use people Analytics. We want to leverage that knowledge. Consulting time is expensive. You should pay for what you need, not for what you can already do. Of course, if you don’t have People Analytics expertise, we are happy to help - RAAS is one thing to learn.
There are lots of APIs. And they all work. But they all work differently. Which means every new piece of data means something new to learn. We’ve learned most of them. But it wasn’t fun.
UKG Pro Rest APIs have their place. If you want to build your own user application, APIs can be the way to go. But for analytics, we think RAAS is the way to go.
Two other options before we leave.
UKG Pro also supports Informatica. Informatica is a complex tool and resources are expensive and not easy to come by. We prefer widely known tools like PowerShell. When you choose an approach, you want to make sure that you’re not dependent on a particular resource.
If you already have a cloud data warehouse like Snowflake or RedShift, you have another option to consider. Portable.io has created a pipeline to take data from UKG Pro directly into several cloud data warehouse like Snowflake and RedShift based on the APIs. We’ve been working with Snowflake for other purposes and as we learn more, we’ll be sure to post.
What have you been using to get your data from UKG Pro?
The post UKG Pro – Reports as a Service vs Rest API appeared first on Red Three Consulting.