Add your feed to SetSticker.com! Promote your sites and attract more customers. It costs only 100 EUROS per YEAR.
Pleasant surprises on every page! Discover new articles, displayed randomly throughout the site. Interesting content, always a click away
Decision Systems
Specialized Solutions - Performance Management & AnalyiticsNot quite ready for IBM Planning Analytics Workspaces? You have options. 26 Dec 2018, 8:50 pm
If you are one of the 70% of IBM customers who hasn’t yet migrated to Planning Analytics Workspaces from IBM TM1 Web or IBM Executive Viewer you haven’t done so for one or more of the following reasons.
- You like what you’re currently using.
- You’re not quite ready to adopt analytics.
- You don’t like Planning Analytics Workspaces.
If this is your situation, you now have a dilemma. You can’t maintain your Planning Analytics Local (PAL) server under your current maintenance and support agreement as newer versions do not support TM1 Web or Executive Viewer.
How has IBM gotten you into this situation?
IBM TM1 had too many user interfaces. This should not be a surprise to anyone familiar with the IBM TM1 / Planning Analytics (PAL) product. Something had to change and IBM took action. IBM Executive Viewer is no longer sold, supported or compatible with the latest version of PAL. IBM TM1 Web is no longer sold and it is not compatible with the latest version of PAL.
The only option according to IBM was to migrate to Planning Analytics Workspaces if you continued to require a browser-based user interface or want to use attribute hierarchies with some UI other than PAX. Yes, IBM made it easy to migrate. Yes, IBM offered customers major financial incentives to migrate. IBM did everything possible to mitigate the pain associated with customers upgrading to PA Workspaces. The question that begs asking is did the migration benefit the customer or IBM?
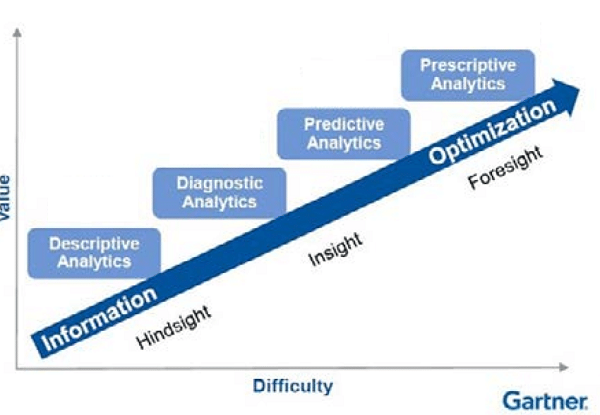
IBM would argue that by migrating to Planning Analytics Workspaces, organizations can take advantage of the benefits that come along with adopting Planning Analytics’ new baked-in analytic capabilities provided, courtesy of IBM Watson. Frankly, I couldn’t agree more. The reality of it all is that not all customers are ready for analytics. IBM knows this better than most. Many prognosticators, including Gartner discuss an organizations analytics quotient which essentially represents where they are on their own path of adopting analytics within their daily decision-making processes and what forms of analysis they use (i.e. descriptive, predictive or prescriptive).
Where then does this leave you, the IBM customer? If you’re among the 70% and would like to know what options you have other than Planning Analytics Workspaces, then Decision Systems Inc. is here to offer you an alternative. Decision Systems has been working with TM1 / Planning Analytics for 30 years and has the answers to your TM1 / Planning Analytics questions. To learn about alternatives to Planning Analytics Workspaces, click here.
The post Not quite ready for IBM Planning Analytics Workspaces? You have options. appeared first on Decision Systems.
Analytics – Like a Mosquito in a Nudist Colony 7 Jul 2017, 6:22 pm
Analytics are like a mosquito in a nudist colony. Why? Because there are so many opportunities! There is a problem, however, that not everyone thinks or behaves like a mosquito. They do not always see opportunities – the opportunities to apply analytics.
I routinely see opportunities for analysis in my daily life. Perhaps I was born with DNA to constantly observe and collect data and evaluate the information for better outcomes. For example, which retail store check-out line should I enter? The answer: first look at the number of items in the shopping carts of those already in line and not only the length of the line.
Of course, that example is a straightforward application of applying analytical investigation. A more complex opportunity is to answer this question. What angle and speed of an airline jet’s take-off ascent and landing descent will optimize its fuel usage? KLM Airlines has developed a sophisticated model to answer this question. It is based on data from thousands of past flights. The results save KLM remarkably significant fuel costs and substantial total expenses since fuel is a substantial portion of an airline’s expense structure.
Analytics’ perils from insect repellant
There is a problem, however, that not everyone thinks or behaves like a mosquito. They do not always see opportunities – the opportunities to apply analytics.
Perhaps I stretch this mosquito analogy too far when I presume that many opportunities may have insect repellent applied to them. For example, at a five star hotel, is staffing an extra customer representative at the check-out counter for the morning rush worth it? It might not appear cost-justified, but it may be a very valuable extra expense if you irritate an important and delayed social media influencer who will complain on Twitter or TripAdvisor.com. How would you know? It is an opportunity for an analyst’s experiment or survey. The insect repellant analogy implies that an analyst may not “sense” an opportunity.
In the book Thinking, Fast and Slow by Dan Kahneman, recipient of the Nobel Prize in Economic Sciences for his seminal work in psychology that challenged the rational model of judgment and decision making, Kahneman explains the two systems that drive the way we think. System 1 is fast, intuitive, and emotional; System 2 is slower, more deliberative, and more logical. System 1 is largely unconscious and it makes snap judgments based upon our memory of similar events and our emotions. System 2 is painfully slow, and is the process by which we consciously check facts and think carefully and rationally.
A problem Kahneman points out is that System 2 thinking (slow) is easily distracted and hard to engage and that System 1 thinking (fast) is wrong as often as it is right. System 1 thinking is easily swayed by our emotions. As an example, he describes an observation that people buy more cans of soup in a grocery store when there is a sign on the display that says “Limit 12 per customer.” People miss the opportunity to analyze.
Life and an organization as a game
People enjoy playing games. The electronic game industry has exploded. Angry birds anyone? The gaming industry (think Las Vegas) is enormous. In a sense one’s own life is a game with aspects that are both serious (e.g., personal tragedies and losses) and fun (e.g., friendships).
Organizations are also playing a game by attempting to out-smart and out-maneuver whatever competitor, stakeholder, or obstacle it needs to defeat, satisfy, or overcome respectively. To win games, one needs to be smart, quick, and agile. Like the mosquito, one needs to detect opportunities and apply superior analytics. Then, check mate.
The post Analytics – Like a Mosquito in a Nudist Colony appeared first on Decision Systems.
Why Do Once Successful Companies Fail 6 Jan 2017, 6:27 pm
How can one explain why seemingly successful companies, such as Borders, Blockbuster, Circuit City, Wang Labs and Digital Equipment, go bankrupt or fall from a successful leadership position? I find it fascinating that almost half of the roughly 25 companies that passed the rigorous tests to be listed in the once-famous book by Tom Peters and Robert Waterman, In Search of Excellence, today either no longer exist, are in bankruptcy, or have performed poorly.
What happened in the 25 years since that book was published? Ponder this question: How many of the original Standard and Poor’s (S&P) 500 list originally created in 1957 are on that list today? Answer: 74 – just 15 percent. And of those 74, only 12 have outperformed the S&P index average. Pretty grim.
My belief is that when it comes to considering whether to implement and integrate enterprise and corporate performance management (EPM/CPM) methods, you make a choice either way – to do it or not to do it. This might seem obvious, but many organizations neglect the fact that the choice to not act – to perpetuate the status quo and continue making decisions the way they currently do – is also a decision.
Invulnerable today, aimless tomorrow
Perhaps it is because when an organization is enjoying success, it breeds aversion to taking calculated risks. Organizations often suffer from the manra, “We don’t do that here.”
But with today’s increasing volatility, uncertainty, and globalization removing trade barriers each new day requires strategic adjustments to anticipate continually changing customer needs and counter-tactics by competitors. Enterprise risk management (ERM) is about balancing risk appetite with risk exposure. If there is not enough risk-taking appetite, then performance will eventually suffer. (If risk appetite is excessive, well, the current global fiscal crisis was evidence of its outcome.) How can an organization create long-term sustained survival?
In Sydney Finkelstein’s book Why Smart Executives Fail, he observed that the causes of failure are not because executives are unintelligent – they are typically quite smart. Finkelstein writes that the causes of failure are not necessarily due to unforeseeable events; companies that have failed often knew what was happening but chose not to do much about it. Nor are the causes of failure always errors due to taking the wrong daily actions.
The explanation involves the attitude of executives. This includes breakdowns in their reasoning, strategic thinking, and efforts to create a culture for metrics and deep analysis.
As earlier mentioned, prominent examples are Wang Labs and Digital Equipment. Wang Labs failed in part because it specialized in computers designed exclusively for word processing and did not foresee general-purpose personal computers with word processing software in the 1980s, mainly developed by IBM.[i] Digital Equipment Corporation (DEC) was satisfied with its dominance in the core minicomputer market, which it was the first computer hardware vendor to introduce. However, DEC was slow to adapt its product line to the new markets for personal computers (PCs). The company’s entry into the personal computer arena in 1982 was a failure, and later PC collaborations with Olivetti and Intel achieved mixed results.
Often, no one challenges the status quo and asks the tough questions. Delusion and fear of the unknown can develop in organizations that affect how they interact with key relationships such as with its customers, suppliers, and partners.
In many cases, executives believe that if there is a control system in place, it will do the job for which it was intended. However, in many organizations, systems and policies are constructed for day-to-day transactions but not for analyzing the abundance of raw data – think Big Data – to make sense of what it all means. Long term sustained performance is based on transforming data into analyzable information for insight and foresight to support decision making. This is where business intelligence, business analytics, and enterprise and corporate performance management systems with embedded analytics fit in. Software technology is no longer the impediment for performing investigation and discovery. Those tools are proven. The impediment involves people requiring skills with behavioral change management.
The emerging need for analytics
With the remnants of the global recession continuing to adversely affect organizations, the stakes have never been higher for managers to make better decisions with analyzable information. Companies that successfully use their information to outthink, outsmart and out-execute their competitors are high-performing enterprises. They build their strategies around information-driven insights that generate results from the power of analytics of all flavors, such as segmentation and regression analysis, and especially predictive analytics. They are proactive, not reactive.
Executives are human and can make mistakes, but when companies fail it is not simply due to minor misjudgments. In many cases, their errors are enormous miscalculations that can be explained by problems with leadership. Regardless of how decentralized some businesses might claim to be in their decision making, corporations can be rapidly brought to the brink of failure by executives whose personal qualities create risks rather than mitigate them. In Finkelstein’s book, he observes that these flaws can be honorable – such as with Wang Labs – or not, as in the headline ethical lapse cases such as Enron, Tyco International, WorldCom, Parmalat, Satyam, and Adelphia.
To sustain long-term success, companies need leaders with vision and inspiration to answer, “Where do we want to go?” By communicating their strategy to managers and employees, they can empower their work force with analytical tools to correctly answer, “How will we get there?”
In the past the best leaders and executives had the best answers. That is not true today. Now the best leaders and executives have the best questions! They can no longer rely on their past experiences or intuition that got them promoted to their C-suite roles. They need to create a culture for analytics including skills and competencies in their work force to be analytical.
[i] Quoted from http://en.wikipedia.org/wiki/Wang_Labs
The post Why Do Once Successful Companies Fail appeared first on Decision Systems.
Who Are the Animals of Analytics-Based Performance Management? 19 Aug 2016, 12:59 am
 Ever notice how the personalities and dispositions of animals often resemble humans’? An organization’s pursuit of adopting analytics-based performance management involves personalities of all types. How are they like the creatures that populate our planet? Here is a zoology of analogous types of employees that you might recognize.
- Lions – These are the managers whom co-workers respect. They are bold and lead their pride. With analytics-based performance management, their boldness enables them to have the will to try emerging managerial concepts. These include strategy maps and their companion, the balanced scorecard; activity-based costing to measure product and customer profitability; and driver-based budgeting with rolling financial forecast updates. In the wild, males seldom live long due to injuries sustained from continuous fighting with rivals. In business, lion-like managers will encounter conflicts in their pursuit and support of these managerial concepts.
- Peacocks – These are those employees who like to look good to everyone. Peacocks cannot fly; this type of employee’s contribution to implementing analytics-based performance management is limited. They like to take credit and display their plumage, but they have not earned the credit they presume to claim.
- Owls – These are those wise sages who truly understand what analytics-based performance management is all about. They tend to be quiet and are careful observers. An owl’s survival strategy depends on stealth and surprise. It would be nice if the owl-like employee would speak up more and tell the lions what is really happening. Who is on board, and who are the naysayer obstacles to applying progressive methods that can result in better decisions – like applying business analytics?
- Rabbits – These are those ready-fire-aim project managers who are impatient with slow progress. Sometimes their sense of urgency is needed to quickly move things along. They endorse techniques like rapid prototyping with iterative remodeling to get sufficient results with speed so that others understand what benefits the methodology can bring. But sometimes, their haste can land the project in a ditch.
- Tortoises – Like the owls, these are very smart workers. They move slowly, but they know where the project should go. Most everyone knows the tortoise and the hare fable. The tortoise won the race because it figured out that having perseverance and a sense of direction is best in the long term.
- Skunks – These employees are bad news for analytics-based performance management projects. Just when there is some traction with getting organizational buy-in from others, they stink up the project with unsubstantiated fears that the project has little or no payoff. They need to be kept distant from the project.
- Armadillos – These are thick-skinned employees whose egos are near impenetrable, just like an armadillo’s armor. They can handle attacks from naysayers who fear change. Armadillos are prolific diggers with sharp claws. Similarly, their analogous employees are heads-down hard workers who want to see the job done.
- Crocodiles – These employees wait ever so quietly until they see an opportunity. Then, when the moment is right, they snap into a debate about whether the project is valid and will lead to improvements. They believe in the project and rarely lose.
- Horses –Workhorses are invaluable. They work long hours making sure that correct and clean data is ready for input to drive the analytics-based performance management projects to yield the insights and actions the projects are designed to deliver. Horses can sleep standing on their legs. This is good for late-hour efforts. Thoroughbred racehorse-type employees are a special breed. They not only work hard but also fast.
- Ostriches – Everyone immediately thinks the analogy for an ostrich might be employees who stick their head in the ground to hide and avoid confrontations. But that is a misconception. Ostriches can run 70 miles per hour and can viciously kick with their legs in conflict. They are nomadic. Ostrich-like managers are strong and also nomadic because they like to move from one functional area to another after they have made their mark. They make an impact at a crucial time in the analytics-based performance management project and then secure a new job elsewhere.
- Snakes – Beware of these types of managers. Snakes can swallow prey much larger than their heads due to the flexibility of their jaws. Some have deathly venom to poison their prey. Analogous managers have similar traits but use office politics in place of venom. They are not interested in the success of the project and are self-centered with no hesitancy to derail a co-worker’s career.
- Beavers – We like beavers. They love to construct dams. Analytics-based performance management is all about model building. A managerial accounting system using activity-based costing principles is a model for measuring how an organization consumes resource expenses into calculated costs of outputs, products, services, channels and customers. A strategy map is a model of the executive team’s strategic objectives and how they causally link the behavior of employees with measures aligned with the strategy. You get what you measure. And beavers are busy workers.
- Eagles – These are the true leaders. Eagles have extremely keen eyesight. Unlike managers who cope with complexity, eagle-like leaders cope with change and must exhibit vision and inspiration. The best leaders for analytics-based performance management have that vision to inform their organization with knowing the direction they want to go. The other managers and employees then determine the best ways to get there.
- Lemmings – The myth of lemmings is that they commit mass suicide when they migrate and mindlessly fall off cliffs. You might think my metaphor of them is the type of employee who goes along unquestionably with their co-workers’ opinions. But the truth is that lemmings are solitary animals who are good at focusing on primary tasks, like burrowing for food. Analytics-based performance projects need this type of intensity in lemming-like employees.
- Sheep – These are employees who are too timid to speak up when the project really needs their help. They are smart enough to differentiate good from bad, but when the project team really needs their support, they are unreliable. Sheep have good hearing; sheep-like employees are sensitive to noise from the naysayers. Sheep have poor eyesight and tend move from darkness to lighted areas. If sheep-like employees cannot see the value in analytics-based performance management methodologies, they move to a comfortable area – the status quo.
- Elephants – Elephants are a symbol of wisdom and are famed for their memory and intelligence. Adult elephants have no natural predators (except humans). Elephant-like employees are important for analytics-based projects because their sharp memories can recall what works and what does not. They are typically veteran workers whose opinions are widely valued. If they buy in, the project has a good chance to succeed.
So, what animal-like types of employees do you work with? Probably all of the types above. The promise for the continued adoption rate of analytics-based performance management is that animals have prospered for thousands of centuries. They survive because there is some balance to how they coexist.
The same prosperity will apply to the increasing adoption rate of analytics-based performance management methods and the software systems that support the methods. Hundreds of types of animals coexist in the wild (mankind willing). Their generations continue. Organizations that maintain balanced and rational thinking will continuously learn and improve the same way that animal offspring learn from their elders.
The post Who Are the Animals of Analytics-Based Performance Management? appeared first on Decision Systems.
Analytics – Big Data – Press Pause on the Stairmaster 11 May 2016, 10:29 pm
I’d like to reflect with you my take on what I believe is driving the accelerating interest in analytics and Big Data. Our lives have become hectic. We are working harder and longer. We talk about life balance, but for so many of us we continue to have life imbalance. Our jobs. Our families. Our security.
Every once in a while we need to step back, press the “pause” button on the Stairmaster exercise machine, take some deep breaths, and reflect on just what the heck is going on.
The two pyramids – (1) executive power and (2) information technology
In the middle fifteen years of my now forty year work career, I was a management consultant with Deloitte, KPMG, and Electronic Data System (EDS, now part of HP). In our slide presentations we always had two types of compulsory slide pictures: a pyramid with multiple layers and a four quadrant grid. Both slide formats provided an over-simplified but effective way of communicating ideas. My explanation for the fast emerging interest in analytics and Big Data can be explained with these two pyramids:
The Executive Power and Influence Pyramid – The savvy executives are realizing they must now delegate and distribute decision rights deeper down into their organization to empowered managers and employees. This is because with the exponentially growing mountain of data, both structured (numbers) and unstructured (text), and a speed-up and volatile world, they can no longer hoard decisions at the C-suite level. The executives are at the top of a pyramid slide labeled “types of decisions.” Their decision types are strategic ones. As examples, what is our organization’s mission? What products and services should we offer to maximize value to our shareholders and owners? Which types of customers are more attractive to retain, grow, win-back, and acquire? What altered strategic direction should we navigate our organization toward?
In contrast, at the lower levels of the pyramid are operational decisions that should be made by employees who ideally have had the strategy communicated to them by the executives (via a strategy map, balanced scorecard, and dashboards). With expanding Big Data, the base of this pyramid is widening, and executives are realizing it is futile for them to be able to explore, investigate, and comprehend this massive treasure trove of data. This why the role of analysts (think “data scientist”) is emerging as being mission-critical. Executives cannot do it all. They must now delegate decision making, and provide analytical tools and capabilities for decisioning to their workforce.
As I have previously written, in the past the best leaders and executives had the best answers. That is not true today. Now the best leaders and executives have the best questions! They can no longer rely on their past experiences or intuition that got them promoted to their C-suite roles. They need to create a culture for analytics including skills and competencies in their work force to be analytical.
The Information Technology (IT) pyramid – This pyramid is chronological from the past at the bottom to today at the top. At the bottom, say around the 1950s, are the initial IT applications of basic and once time-consuming manual efforts of payroll and purchasing. Cutting bank checks. Then in the 1960s came invoicing, bookkeeping, and financial accounting IT applications. Next came the waves of customer relationship management (CRM), enterprise resource planning (ERP), and supply chain management systems.
The next higher pyramid layers involved information management and data warehouse technologies to enable the managerial systems. Then came the evolution of business intelligence highlighted with query-and-search drill-down capabilities. Next came business analytics with its four micro-levels – descriptive, diagnostic, predictive, and prescriptive / optimization analytics.
I would argue that we have now reached the peak of this IT pyramid where executives, sitting at the top, can nimbly navigate the execution of their dynamic and constantly adjusting strategy with agility. Poor execution of a well-formulated strategy is a major frustration and source of downfall of executives. This pyramid’s peak represents a GPS-like capability for executives at the helm to use metrics, performance measures and indicators, powerful planning capabilities, and motivational methods to gain insights and drive the behavior of employees, customers, suppliers, and partners.
Where do we go from here?
Are there new yet to be constructed layers at the top of these two pyramids? I would argue no (but start perfecting that “prescriptive / optimization analytics” layer). Technology is no longer the impediment to driving improvement. It is proven. The obstacle is now people and behavioral change management. This involves increasing the skills and competencies of employees with analytics. The major barrier is overcoming resistance to change which is human nature. The two pyramids have reached their peak.
The issues now involve strengthening the layers and making them more efficient and effective. The new higher weight at the top of both of the pyramids needs a strong foundation, and this involves an organization’s culture and leadership style.
The post Analytics – Big Data – Press Pause on the Stairmaster appeared first on Decision Systems.
Beethoven and Analytics – Based Enterprise Performance Management 20 Jan 2016, 7:27 pm
I was educated as an industrial engineer, but I sometimes masquerade as an accountant. Engineers are not perceived as very worldly or sophisticated. They are often pictured with a shirt-pocket protector stuffed with pens. But some engineers, like me, do have appreciation for the performing arts. For example, I appreciate classical music. In particular, I admire and am in awe of the great classical music composers. How did Tchaikovsky and Mendelssohn transcribe such beautiful music as notes from their brain to a page of musical score for so many instruments? (Hint: I don’t think they had a smartphone or email to distract them.)
I believe that in the next few years the adoption rate for enterprise performance management (EPM) methods imbedded with business analytics will accelerate. Core EPM methods include strategy management (strategy maps, balanced scorecard, dashboards); profitability analysis (by products, channels, and customers); driver-based budgets and rolling financial forecasts), enterprise risk management (ERM); and continuous improvement (lean and six sigma quality management). They should ideally be seamlessly integrated.
This acceleration will have an effect similar to the one Ludwig van Beethoven’s masterpiece – his third symphony, Eroica – had on the future of classical music. Beethoven followed Eroica with his universally memorable fourth to ninth symphonies, and other great composers emulated him. What connection am I making between classical music and EPM?
Breaking free from tradition
Ever hear much about Beethoven’s first or second symphony? Few people have. That is because it was with Eroica, his third symphony, where Beethoven himself is quoted as saying, “I will now take a new path.” It was a radical change in music composition.
Eroica, inspired by Beethoven’s admiration for Napoleon as a world leader, had true melody. Prior to Eroica, Beethoven’s compositions followed a tradition where melody was rare. He complied with the conventional rules of what tasteful music for the elite should sound like. His prior music was influenced by masters who dared not change from tradition, such as Bach and Haydn. But Beethoven had a strong urge to break free from tradition. With Eroica , classical music was changed forever.
The evidence of the “Eroica effect” is this: How many billions of people, including you and me, will die with little trace of remembrance generations from now but a tombstone? But the works of Beethoven, Mozart, Rossini, Sibelius, Grieg and others in their league will be listened to for a long time to come – possibly for centuries.
Are we now at a point where the implementation of EPM’s suite of integrated methodologies, like Eroica, will also “take a new path?” Yes – because tradition increasingly gives way to change, and organizations are slowly and gradually learning to not just manage change but to drive change.
Will EPM soar in the Cloud?
The acceleration of EPM will not be restricted to only implementing or improving its core methods. With the advent of mobile solutions and Cloud technology rather than on-premises platforms, the potential is not only for improving EPM. It will radically change the way EPM methods are implemented, deployed and maintained. This potential also impacts the way that information produced by EPM solutions will be consumed by enterprise users. Mobility solutions, which have been around for a short time now, provide a basis on which to extend the use of EPM information and to gather EPM data inputs to global enterprise users. It’s not just a back-room, batch function any more – it’s information for enterprise users, anytime, anywhere! And of course mobile EPM solutions will evolve to support the demands of those enterprise users, who are now more than familiar with mobile devices in their personal lives and which will begin to blend with their working lives too.
The future of enterprise performance management
People are what it’s all about, so I honor and respect the importance of applying the principles of behavioral change management. However, my love for quantitative analysis influences me to conclude with a short narration by the great Princeton University mathematician and Nobel Prize winner John Nash. Nash introduced a theory describing how rational human beings should behave if there is a conflict of interest. In the Academy Award-winning movie about Nash’s life, A Beautiful Mind, he said:
“I like numbers because with numbers truth and beauty are the same thing. You know you are getting somewhere when the equations start looking beautiful. And you know that the numbers are taking you closer to the secret of how things are.”
The executive management teams with the courage, will, caring attitude and leadership traits to take calculated risks and be decisive will likely be the initial adopters of a fully integrated EPM system imbedded with business analytics. They will achieve the full vision of EPM. Other executive management teams will follow them.
The post Beethoven and Analytics – Based Enterprise Performance Management appeared first on Decision Systems.
Baseball + Analytics = Improved Performance 4 Nov 2015, 5:23 pm
How does an organization create a culture of metrics? One example is the community of baseball, including its managers, team owners, scouts, players and fans. With better information and analysis of that information, baseball teams perform better – they win!
Legendary baseball manager Connie Mack’s 3,776 career victories is one of the most unbreakable records in baseball. Mack won nine pennants and five World Series titles in a career that spanned the first half of the 20th century. One way he gained an advantage over his contemporary managers was by understanding which player skills and metrics most contributed to winning. He was before his time in that he favored hitting power and on-base percentage players to those with a high batting average and speed – an idea that would later become the standard throughout the sport.
The 2003 book about the business of baseball, Moneyball, describes the depth of analytics that general managers like Billy Beane of the Oakland Athletics apply to selecting the best players, plus batter and pitcher tactics based on the conditions of the team scores, inning, number of outs, and runners on base. More recently, the relatively young general manager of the Boston Red Sox, Theo Epstein (who is now with the Chicago Cubs), assured himself of legendary status for how he applied statistics to help overcome the Curse of the Bambino – supposedly originating when the team sold Babe Ruth in 1920 to the New York Yankees – to finally defeat their arch-rival Yankees in 2004 and win a World Series. It ended Boston’s 86-year drought – since 1918 – without a World Series title.
An obsession for baseball statistics
Gerald W. Sculley was an economist most known for his article, “Pay for Performance in Major League Baseball,” which was published in The American Economic Review in December 1974. The article described a method of determining the contribution of individual players to the performance of their teams. He used statistical measures like slugging percentage for hitters and the strikeout-to-walk ratio for pitchers and devised a complex formula for determining team revenue that involved a team’s won-lost percentage and market characteristics of its home stadium, among other factors.
The Society for American Baseball Research (www.sabr.org), of which I have been a member since the mid-1980s, includes arguably the most obsessive “sabermetrics” fanatics. As a result of hard efforts to reconstruct detailed box scores of every baseball game ever played, and load them into accessible databases, SABR members continue to examine daily every imaginable angle of the game. Bill James, one of SABR’s pioneers and author of The Bill James Baseball Abstract, first published in 1977, is revered as a top authority of baseball analytics.
I have been intrigued by baseball statistics from an early age. As a child I used dice for each player’s at-bat to play hundreds of baseball games. In 1970 for a course on game theory at Cornell University, I recreated my childhood game with computer software using a random number generator calibrated to the actual statistics of each batter and pitcher for the 1969 National League season. The result was that each team’s won-lost record closely matched their records of the actual season. I am proud that this computer program has been inducted in the National Baseball Hall of Fame & Museum as the oldest computer baseball game. This was obviously not as big an achievement as the Wright brothers or Charles Lindbergh, but it is something my grandsons marvel at.
Business analytics to improve business results
What does this have to do with enterprise and corporate performance management (EPM/CPM) methods? A lot. I have loudly advocated that EPM/CPM is the integration of dozens of methods, like strategy maps, key performance indicator (KPI) scorecards, customer profitability analysis, risk management and process improvement. But I have insisted that each method requires imbedded analytics of all flavors, and especially predictive analytics needed. Predictive analytics anticipate the future with reduced uncertainty to enable being proactive with decisions and not reactive after the fact, when it may be too late.
A practical example is analytics imbedded in strategy maps, the visualization of an executive team’s causally linked strategic objectives. Statistical correlation analysis can be applied among influencing and influenced KPIs. Organizations struggle with identifying what is most relevant to measure and then determine what the best target is for that measure. Software from business analytics vendors can now calculate the strength or weakness of causal relationships among the KPIs and display them visually, such as with the thickness or colors of the connecting arrows in a strategy map. This can validate the quality of KPIs selected. It creates a scientific laboratory for strategy management.
Returning to baseball, an evolving application of business analytics relates to dynamic home stadium ticket prices to optimize revenues. The San Francisco Giants experiment with mathematical equations that weigh ticket sales data, weather forecasts, upcoming pitching matchups and other variables to help decide whether the team should incrementally raise or lower prices right up until game day.[i] The revenue from a seat in a baseball stadium is immediately perishable after the game is played. So any extra available seat sold at any price directly drops to the bottom line as additional profit.
Another baseball analytics example involves predicting player injuries, which are increasing at an alarming rate. Using an actuarial approach similar to the insurance industry, the Los Angeles Dodgers’ director of medical services and head athletic trainer, Stan Conte, has been refining a mathematical formula designed to help the Dodgers avoid players who spend their days in the training room and not on the ball field. A player on the injured reserve list is expensive in terms of the missed opportunity from their play and the extra cost to replace them. Conte has compiled 15 years of data plus medical records to test his hypothesis that predict the chances a player will be injured and why.[ii]
Greater statistical analysis is yet to come. The New York Times has reported on new technology that could shift previously hard-to-quantify baseball debates such as the rangiest shortstop or the quickest center fielder from the realm of argument to mathematical equations. A new camera and associated software in its final testing phases will record the precise speed and location of the ball and every player on the field. It will dynamically digitize everything, allowing a treasure trove of new statistics to analyze.[iii] Which right fielders charge the ball quickest and then throw the ball the hardest and most accurately? Guesswork and opinion will give way to fact-based measures.
Create a culture for metrics
Here is some easy math:
baseball + analytics = improved performance
business + business analytics = improved business performance
If you cannot measure it, you cannot manage it. With metrics, you can improve it. Create a culture for metrics in your organization. It will provide a competitive edge.
[i] Ken Belson, “Baseball Tickets Too Much? Check Back Tomorrow,” The New York Times: May 18, 2009. http://www.nytimes.com/2009/05/18/sports/baseball/18pricing.html
[ii] Michael S. Schmidt, “Turning the Trainer’s Table into an Actuarial Table,” The New York Times: July 8, 2009. http://www.nytimes.com/2009/07/08/sports/baseball/08injuries.html?scp=1&sq=Actuarial&st=cse
[iii] Alan Schwarz, “Digital Eyes Will Chart Baseball’s Unseen Skills,” The New York Times: July 9, 2009. http://www.nytimes.com/2009/07/10/sports/baseball/10cameras.html?_r=1&em
The post Baseball + Analytics = Improved Performance appeared first on Decision Systems.
Why Will Analytics Be the Next Competitive Edge? 7 Sep 2015, 11:12 pm
Analytics is becoming a competitive edge for organizations. Once being a “nice-to-have,” applying analytics is now becoming mission-critical.
An Aug. 6, 2009, New York Times article titled, “For Today’s Graduate, Just One Word: Statistics”(1) reminds me of the famous quote of advice to Dustin Hoffman’s character in his career breakthrough movie The Graduate. It occurs when a self-righteous Los Angeles businessman takes aside the baby-faced Benjamin Braddock, played by Hoffman, and declares, “I just want to say one word to you – just one word – ‘plastics.’ ” Perhaps a remake of this movie will be made and updated with the word analytics substituted for plastics.
The use of analytics that include statistics is a skill that is gaining mainstream value due to the increasingly thinner margin for decision error. There’s a requirement to gain insights and inferences from the treasure chest of raw transactional data that so many organizations have now stored (and are continuing to store) in a digital format. Organizations are drowning in data but starving for information. The application of analytics is becoming commonly accepted, but will senior executives realize it?
How do executives and managers mature in applying accepted methods?
Managers today are maturing in applying progressive managerial methods. Consider this. Roughly 50 years ago, CEOs hired accountants to do the financial analysis of a company, because this was too complex for them to fully grasp. Today, all CEOs and mainstream businesspeople know what price-earnings (PE) ratios and cash flow statements are and that they are essential to interpreting a business’ financial health. They would not survive or get the job without this knowledge.
Twenty years ago CEOs of companies did not have computers on their desks. They did not have the time or skill to operate these complex machines and applications, so they had their secretaries and other staffs do this for them. Today you will become obsolete if you don’t at least personally possess multiple electronic devices such as laptops, mobile phones, BlackBerrys and PDAs to have the information you need at your fingertips.
Business analytics are the next wave
Today many businesspeople don’t really know what predictive modeling, forecasting, design of experiments or mathematical optimization mean or do, but over the next 10 years, use of these powerful techniques will have to become mainstream, just as financial analysis and computers have, if businesses want to thrive in a highly competitive and regulated marketplace. Executives, managers and employee teams who do not understand, interpret and leverage these assets will be challenged to survive.
When we look at what kids are learning in school, then that is certainly true. We were all taught mean, mode, range, and probability theory in our first-year university statistical analytics course. Today children have already learned these in the third grade! They are taught these methods in a very practical way. If you had x dimes, y quarters and z nickels in your pocket, what is the chance of you pulling a dime from your pocket? Learning about range, mode, median, interpolation and extrapolation follow in short succession. We are already seeing the impact of this with Gen Y/Echo boomers who are getting ready to enter the work force – they are used to having easy access to information and are highly self-sufficient in understanding its utility. The next generation after that will not have any fear of analytics or look toward an “expert” to do the math.
There is always risk when decisions are made based on intuition, gut feel, flawed and misleading data or politics. In Babson College Professor Tom Davenport’s popular book, Competing on Analytics: The New Science of Winning (2), he makes the case that increasingly, the primary source of attaining a competitive advantage will be an organization’s competence in mastering all flavors of analytics. If your management team is analytics-impaired, then your organization is at risk. Analytics is arguably the next wave for organizations to successfully compete and optimize the use of their resources, assets and trading partners.
Substantial benefits are realized from applying a systematic exploration of quantitative relationships among performance management factors. When the primary factors that drive an organization’s success are measured, closely monitored and predicted, that organization is in a much better situation to adjust in advance and mitigate risks. That is, if a company is able to know – not just guess – which nonfinancial performance variables directly influence financial results, then it has a leg up on its competitors.
______________________________________________________
1. http://www.nytimes.com/2009/08/06/technology/06stats.html?scp=1&sq=Graduate%20statistics&st=cse
2. Thomas H. Davenport and Jeanne G. Harris, Competing on Analytics: The New Science of Winning. Boston: Harvard Business School Publishing, 2007.
The post Why Will Analytics Be the Next Competitive Edge? appeared first on Decision Systems.
Proactive analytics and unstructured data are the key components of an operational business performance management solution 8 Jun 2015, 5:41 pm
Over the last twenty years, we have seen steady growth in the use and popularity of business performance management (BPM) solutions. If you look at business performance management use by functional area, you will find that it has been deployed in the approximate ratio of 60% financial, 30% marketing and 10% operational. Thus, if you have been using business performance management to analyze data, it is likely that you have been working with financial or marketing data.
Perhaps it is time to realize that traditional BPM systems have not “cut it” when it comes to operational business performance management. With exponential growth in computing power delivering voluminous amounts of near real-time structured and unstructured operational data, there is clearly a void in the ability of traditional BPM solutions to address operational use. BPM vendors have been listening to the market and now recognize the market opportunity. If you are looking for a BPM solution that addresses operational business performance management, don’t be fooled by the often clever product repositioning statements of some vendors. What should you look for if your organization is beginning to investigate operational business performance management? Two areas that operational business performance management should address are proactive analytics and unstructured data.
Proactive Analytics
We are clearly entering the next phase of business performance management use which could aptly be called “proactive business performance management.” Initially, BPM systems ran in batch mode. They were soon replaced by interactive BPM systems which have been the norm during the last decade. Proactive business performance management facilitates operational analytics by giving organizations the ability to “automate” what was the interactive OLAP slice-and-dice discovery process offered by traditional BPM solutions. This automated discovery process is a “must have” feature for operational business performance management analysis for two simple reasons: once analysts have asked all the questions they know to ask of their data, there is simply too much data and too much complexity for any team of analysts to know where to look next. To expect that a business person can “discover” a valuable insight hidden in their data by stumbling across it is not an effective way to become proactive. With the proliferation of data, users need to be guided to emerging issues they had previously never considered.
The post Proactive analytics and unstructured data are the key components of an operational business performance management solution appeared first on Decision Systems.
Business Performance Management: Build vs. Buy 8 Jun 2015, 5:40 pm
While most organizations wouldn’t even consider building their own transaction processing system, the build vs. buy decision is most definitely on the minds of individuals charged with leveraging business performance management systems (BPM) today.
Tools vs. Applications
Software technology, within any given market niche, usually begins with the introduction of tools that enable early adopters to develop their own application solutions. These early adopters are usually very familiar with their business problem, are technically well versed, independent-minded and unafraid of leveraging unproven technologies that haven’t been productized. They’re willing to take on the risks associated with new technology because their “vision” tells them that the potential competitive advantages are greater than the associated risks. Application solutions offered by vendors usually appear later in the software technology life-cycle and often replace these early tools. Whether these applications are horizontal or vertical in nature, the appearance of applications usually signals a more mature market.
Transaction Processing vs. Business Performance Management
Application solution vendors can better serve the transaction processing market. Transaction processing methodologies and requirements are better known and are more similar in nature then their BPM counterparts. In many respects, this is why transactional systems development using tools is often replaced by vendor application solutions.
Business performance management has followed a somewhat different path. First, vendors offered tools and soon thereafter some application solutions appeared including reporting, budgeting and forecasting systems. The key difference is that because of the diverse nature of BPM, tools continued to maintain a presence, though somewhat limited.
What’s unique to business performance management vs. transaction processing is that business problems involve end-users who may not fully understand problems upfront. Tools that facilitate prototyping and rapid application development, used by individuals who understand the business, may be a better fit. They may enable overall faster deployments then application solutions, which, in part, may explain why BPM tools survived. That being said, BPM application solution vendors did quite well over the past decade, but the winds of change are in the air.
Benefits of Tools vs. Applications for Business Performance Management
What’s going on here is that organizations are beginning to realize that perhaps the diverse nature of business performance management is better served by productized tools vs. traditional application solutions. The evidence, as collected by BPM Partners and other prognosticators, tells us that overall costs and time to implement are reported to be lower today by those organizations using tools vs. those using application solutions.
That’s not to say that every organization should build its own BPM application. Certainly, due consideration should be given to the likelihood for success. What is interesting is that, while one would expect BPM application solutions to be more expensive then their tool counterparts, these same reports show that the time to deploy the application solution is greater as well!
The production of BPM tools offered by vendors such as Microsoft and Applix has enabled organizations to leverage BPM tools like never before. This becomes more relevant with the long time needed to customize and deploy application solutions offered by vendors such as Hyperion and Cognos. Clearly, the complexities of customizing BPM application solutions play a big part in deployment times. Perhaps the scopes of application solutions are greater than those of tool implementations. This could explain differences in time to deploy. Given the choice, however, most organizations would choose to start small and have a few small successes vs. taking the time, effort and risks larger application solutions offer. Because of the unique nature of Business Performance Management, the make vs. buy decision will continue to be pertinent.
Whether you choose to purchase a BPM application or build one using a consultant or internal resources, the choice is yours. The first step toward deploying a successful business performance management is to consider both options.
The post Business Performance Management: Build vs. Buy appeared first on Decision Systems.