ServiceNow Reporting, IT Analytics, IT Dashboards, IT Reporting
The DevOps Revolution
The DevOps revolution has taken hold, at least in concept, in a broad range of organizations. In the more advanced organizations, there are teams of Agile-certified scrum masters. IT line staff and managers are trained in the principles, and they typically manage their work in software suites like JIRA, Azure DevOps, and ServiceNow. The process investment in most cases is significant.
Often these practices are successful in individual teams, achieving the increased throughput and rapid feature development for certain applications. Even in these cases, however, the organization-wide transformation remains elusive. Process victories are isolated to proof of concept initiatives, and the understanding of progress remains hidden at upper levels of management. The end result is that the goal of ten releases per day feels just as far away as it did in the waterfall era, and the return on the investment in Agile practices is impossible to assess.
Make DevOps Visible
An important first step is measuring adherence to the DevOps process. DevOps is not a shackle, but it contains a number of counterintuitive practices that require radical change for development teams. Reducing batch size means breaking work into much smaller deliverables, which can be a real shift for developers that enjoy wrestling with complexity. Respecting the sanctity of sprints means turning down requests from vocal and insistent internal customers, which requires a different discipline for developers that want to please and derive a sense of pride from being able to build anything. These few examples stand in for many, each giving rise to real resistance to adoption.
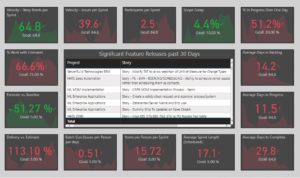
You get what you measure. Teams following the new practices need to be praised and recognized. In order for management to do so, it is critical to have reliable metrics on these behaviors that evaluate team and individual performance. The good news is that the data required to calculate these metrics are captured in the systems that manage this work and that DevOps is a mature enough practice that consensus around the metrics has been established. The bad news is that the data has rarely been consolidated and presented to management in a reliable and actionable medium. We do have some good news on that front below.
Elevate Bottlenecks
The key to achieving increased velocity and throughput for application development as well as for any production process is the ability to identify and remove bottlenecks in the production process. In a manufacturing shop, the identification process is relatively easy. A manager can walk around the shop floor and see where inventory is piling up. This is the bottleneck.
In software, we don’t have physical inventory, but we do have work in progress. We can see this backlogged work in individual assignment queues. The nice thing here is that we don’t have to walk around. All the work is tracked within our project management systems.
Let’s take a moment to state that bottleneck is not a dirty word. The bottleneck in any IT process is almost always the rock star of the group. For example, let’s talk about our star developer David Lee. Everybody Wants Some David Lee on their task. Whether it’s developing the capability of their Dreams, a particularly risky change implementation, or a critical incident Eruption, David Lee is the go-to guy. What eventually happens is that all work is waiting on David Lee to complete it. David Lee, despite his best efforts and supernatural energy, is the bottleneck for the organization.
What management needs to do is alleviate the bottleneck by assigning these tasks to other people. That means making the difficult decision of assigning a critical incident to someone who will take longer to address it, assigning a change implementation to someone with less familiarity with the application, or farming development tasks, though critical, to one or more team members that will take twice as long to complete them.
These are all decisions that seem career limiting unless the bottleneck is identified and it can be communicated to management that sub-optimizing these individual tasks will increase the throughput for the organization as a whole. It’s even likely that each task will be completed earlier than if the rock star himself were working on it since they don’t have to say I’ll Wait for David Lee to Jump.
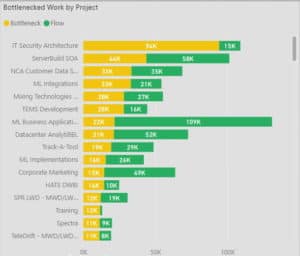
One of the problems here is that the development work queues and service work queues (incidents and changes) typically reside in different systems, so it becomes difficult to evaluate and compare the total value of the work queue. If only somebody had a solution. For some good news on that topic, click the graph below and let us show you how it works.
Rock on!
The post Save your Rock Stars with DevOps Dashboards first appeared on Northcraft Analytics.
The price of a rational ServiceNow renewal bill is eternal vigilance – Attribution Unknown
Way back in the normal times, after lunching with colleagues indoors, we would return to our software license audits and find unused licenses that accounted for 5-10% of the total. We would assign tasks to the departments with idle licenses and tell ourselves that we would need to keep an eye on that.
I don’t know about you, but last year was somewhat unusual for us. The slow shifting of personnel that regularly orphans software licenses accelerated until departments became unrecognizable. The software audits that we perform for our customers started turning up unused licenses in the 20-30% range. What had been a duty of diligence, like changing the air filters, or mailing back the DVD has become a top-of-the-agenda action item. Let’s focus on ServiceNow as a representative case, but the example will serve many.
ServiceNow Renewal – Understand your Hand
A software license based on the number of users has a built-in advantage for a SaaS software provider. In most cases, they know, or at least can pretend to know the usage of the software better than you. It can feel like you’re playing poker with someone that can see your cards.
Knowing your hand and theirs is always the most important factor in a successful ServiceNow renewal negotiation. It is guaranteed that they are coming with new licensing structures, new product offerings, and plans for expansions in the license base. Once these are accepted in one renewal, they can become very difficult to unwind in subsequent negotiations. ServiceNow is not going to make it easy for you to see where you can push back and slow down the growth of the overall bill.
ServiceNow is going to have a detailed list of users that they can back up with data. The spreadsheets are long. The user’s names are obscured, but the detail seems to be consistent. It makes some intuitive sense that the number of licenses required is going to increase by a low double-digit percentage. Without the detail to push back, most of us just bend our knees and move on to the next point.
Preparation and a structured audit can help here. Visibility into the people, departments, and roles is going to uncover unused licenses in three areas:
- License Churn
- Zombie Licenses
- Over-permission
By identifying a pool of unused license capacity, you can typically cut out the line item for additional licenses completely. In many cases, this is large enough to push for savings and credits in other areas.
License Churn
It happens to the best of us. In a normal year, there is always a non-negligible amount of churn in the employee base that inflates the number of licenses “consumed.” For example, if David Lee moves on and is replaced by Sammy, both may appear to be valid users of the system and get double counted in the user base. When there is a significant change to the organization, like offshoring or perhaps the complete virtualization of the workforce for a year due to an unforeseen global pandemic, the impact on license utilization can be enormous. Again, 20-30% is not unusual emerging from the debris of 2020.
Zombie Licenses
Zombie licenses are a special form of churn. We typically consider churn to licenses that have gone inactive from one renewal to the next. Zombies have either survived from a previous renewal, or they have never been used. They differ from churn in that their number doesn’t spike in current events, but when running an audit for a new customer, we typically see around 10% of the licenses unused for over a year. This level alone can be enough to freeze the license growth in a renewal negotiation.
Over-Permission
The third area of savings is over-permission licenses. The most concrete and typical case is the proliferation of ITIL licenses. As ServiceNow reaches farther into the organization, the understanding of roles becomes even more critical. ServiceNow has powerful functionality around Agile and project management. However, these functions do not require the more expensive ITIL licenses.
There are different flavors of this, but the most common is a type of ITIL zombie, where the user is active in ServiceNow, but has never performed an ITIL task. There is also ITIL churn, where the user remains active but no longer performs tasks requiring the ITIL role.
Know More than your Opponent
ServiceNow roles are added and revoked to users every day. Each one has the potential to drive license costs but is very difficult to monitor without individual records in history. A role that is added on the last day of the year should not cost the same as one that was added on January 1. ServiceNow will view them the same way in renewal because they do not have that level of visibility. When making your projections for license use, the proper metrics are role utilization days. Projections made from this basis will always be lower than those viewed from the full year, and more accurately track your organization’s full utilization.
Be Prepared
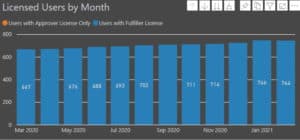
Make sure you walk into your renewal negotiation with your own targets for next year’s licenses. If you have clearly identified these areas of savings and can tie specific user names to the areas, you will at least be able to freeze this area of growth in your overall license cost. At best, you will be able to further rationalize your bill and bring your cost in line with actual usage. If you need help in preparing this detail, Northcraft Analytics can provide you with a detailed suite of interactive reports for use in your next negotiation. Just click the illustrative graphic below to contact us.
The post Managing User Licenses Post Pandemic first appeared on Northcraft Analytics.
That for which we have no language, we must pass over in silence. – Ludwig Wittgenstein
Creating the CMDB Language
One of the greatest difficulties for IT executives is communicating why we do what we do to the rest of the organization. This is no small matter. When this communication fails, the organization can only view IT as a cost center, and cost centers are only targeted for reduction. In many organizations, this mentality has firmly taken hold, and the reductions are quite visible in outsourced operations, even outsourced management. It appears that this has even become the majority view, though certainly not the unanimous one.
It may not be overstating the case to say that IT’s status as a cost center is the dividing line between the old and the new economy. On one side, IT talent is viewed as a commodity where one body can be swapped for another. On the other, companies viciously compete for IT talent with recruiting programs, benefits packages, and salaries that astonish the other side. There is little question about which side of the line is the more profitable, which has more rapid growth, or which will comprise the majority of the Fortune 500 in the next decade.
We do ourselves and our organizations a disservice when we do not take the opportunity to make our case in the language of the business. IT is the business of creating magic! We should be proud to tell this story. Which of your major projects in the past 5 years was not fundamentally an IT project? How much of what you did in your position was even imaginable ten years ago? IT enabled everyone to do their job in their pajamas for a year and most of them did it better because they weren’t sitting in their co-workers’ cube arguing about whether it was Pacino or De Niro in Heat.
It is incumbent upon us all to translate the value of our work into the language of the business. That begins with understanding that value ourselves. What capability did we create? What risk did we eliminate? Most of the time, we do, or we did understand the initial reason for a project or task. However, this can get lost over time, repetition, and transition until the reason becomes, “we do this because we do this.” It is necessary to surface the value statement for a project early and often.
Just as often, tasks and projects are nested several layers deep in dependencies, and the value is not as immediately obvious. The CMDB tends to fall into this category. We spoke a bit about this in our previous article, but let us state for the record that populated properly, the CMDB can be a foundation for:
- Disaster Recovery
- Cloud Transformation and Cost Management
- Cost Allocation to Line of Business
- Change Management Risk Reduction
- Vulnerability Management
- Inventory Management
These are all operational goals for management, and this is certainly not exhaustive. Nearly every project of organizational significance has a critical IT component, and nearly every one of those IT components has deployments that can be accelerated or roadblocks that can be removed by utilizing a properly populated CMDB. It is critical to tie the population effort to the projects that they enable.
Regardless of whether we have or have not stopped believing, the CMDB is not a magical bird descending upon us to grant wishes. It is a painstakingly built repository of data gathered manually and through automated discovery for express purposes. If your project or use case is new, the CMDB likely does not contain all the data required to achieve your goal. This is not a cause for cursing, and it is also not the time to look upwards for magical birds with the phrase, “The CMDB should already have that.” As stated before, the CMDB should not have anything that is not already recognized as valuable to the organization (caveat, if it’s free, it might not hurt). This is a time to turn to the infrastructure owners to see what is possible.
You get what you measure
Let’s assume you get a “yes,” or a “yes, but it’s going to cost something” from the infrastructure owners. Let us also assume that you know the value of the capabilities your project will produce or the risks it will mitigate, and that value considerably exceeds that of the cost of gathering the data. May I also assume that somebody is writing this part down?
Given that the CMDB enhancements are now greenlighted, the key to success is tracking and verification. Ostensibly, your request has consisted of: “I need these {a} attributes and these {r} relationships.” If you want to measure whether or not you’re getting what you pay for, you’ll need metrics and a way to observe them. The blood and guts way of measuring this is to create a flag for each attribute {a1 – an} and each relationship {r1 – rn}. One should. This will enable the infrastructure owners to identify problem areas and identify individual CIs that require action.
However, this will not get you where you need to go. Look at all that notation up there. Subscripts, CIs!? The disengagement you’re feeling is the same emotion everyone in Line of Business feels when they talk to us. Clearly, this needs to be done, but where’s the headline? What capability is being produced? What risk is being mitigated? Where is the value?
Give the business a headline. This consists of two things. The first is the headline metric, and it reads something like:
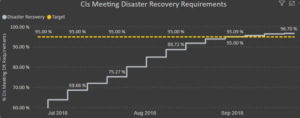
Percentage of Infrastructure Meeting Disaster Recovery Requirements
Catches the eye, no? The headline metric consolidates all of the sub-metrics into one topline number that the organization can respond to. It is also fundamentally Agile. For a piece of infrastructure, nothing is done until everything is done. This approach gives no credit for Work in Progress. It attributes value to results rather than work. We know with certainty that the organization is better off when the number goes up.
This brings up the second requirement. In order to know whether the organization is improving, it is necessary to have the ability to track the headline metric over time. This actually goes beyond knowledge of improvement. It is very difficult to know whether the current number associated with the headline metric is good or bad out of context. Suppose the Percentage of Infrastructure Meeting DR Requirements is 61%. There are no industry benchmarks for numbers like these. You might even be one of the pioneers in your industry in this regard. However, you can be sure that 61% is a good number if it was 49% last week.
Suppose now that we have all the measurements that we have proposed. We can tell the executives that our company is more resilient to unexpected events due to the effort and money expended over the past few weeks. As a project owner can see that my project is moving toward success in a measurable and significant way. I can also see who is doing great work and who needs coaching. The infrastructure owners are also able to more quickly identify what items require action and see directly how their efforts are accruing to the benefit of the organization. Not bad, why doesn’t everyone do this?
Roadblocks
Creating the headline metric shouldn’t be too bad. If the requirements for the project are clear, the headline metric merely needs to be able to evaluate that each of the requirements is satisfied. That formula may contain 30+ elements, but a competent analyst should be able to pull that off. As complexity increases, so does the level of testing that is advisable before making the metric visible to critical eyes.
You can never step in the same river twice
The real roadblock is in trending CMDB data. The CMDB is the picture of the infrastructure of an organization at the current moment. The accounting metaphor for the CMDB is the balance sheet. The balance sheet is taken at a point in time, and a past balance sheet can be created with a current one and an income statement.
If only we could do the same for the CMDB. The problem with the accounting metaphor is that there is an enormous level of formalism in financial accounting that is neither followed nor desirable in the IT space. Creating a view of the past from the current CMDB and the logs of changes is theoretically possible, but prohibitively expensive in terms of time and expense.
The amount of data contained within a CMDB is also huge. Relational databases struggle with processing standard organization-wide reports out of the repository. Lights dim, and nobody can make coffee. What is required is the ability to take periodic snapshots of at least the headline metrics, preferably the detail metrics, and even more preferably, the full state of the CMDB. Even if that were to occur, it would be necessary to report off a source that would be many multiples of the size of the CMDB itself. This is typically the stumbling block. Even some of the best companies resort to keeping copies of spreadsheets around archived with highly suspect naming conventions.
But what if you could do it the right way?
The post Overcoming CMDB Shame: Part Two first appeared on Northcraft Analytics.
For over a decade, I have yet to meet a client that does not experience some level of shame when discussing their CMDB. For the record, most of the people that I speak to on this topic work in the IT Service departments of companies with a household name. They would all quickly tell you about recently completed projects indistinguishable from magic. Yet, the CMDB remains a subject for grumbling. Why all the guilt? Why everyone?
Every CMDB is Beautiful in its Own Way
Each of us for whom the topic bears relevance was raised in the same textbook, and we read it very early on. A CMDB or Configuration Management Database simply records every person place or thing in the IT space and maps the relationships among each to another. Once this is complete, such a mapping will be very valuable as a foundation for conducting Change Management and all sorts of other value-creating ITIL activities. Theoretically, this is true.
Unfortunately, if not impossible, creating and maintaining such a repository is impractical. I cut my teeth in the airlines, another industry that created CMDBs. In an airline, the Configuration Management Database was created to facilitate the maintenance program. They recorded every screw on every aircraft, the last time it was tightened, and the requirements for the next time it needed to be tightened. Without such information, engines fall off moving aircraft more frequently, so it does tend to focus the mind. When such a project was successful, installation took 5 years and cost 150 million late 1990s dollars. Maybe consultants and airlines got better at it, but a thumb in the wind, that still seems like a fair estimate of effort.
 The effort required for the IT task as defined above is at least as significant and seems to be expanding all the time. The group of objects to be contained within a CMDB include not just hardware, software, people, and places, but abstract items as well such as Services and Business Units. In English, we call the members of that group nouns. In IT, we call them Configuration Items (CIs).
Given that the scope of items collected exceeds that of the airline example and that the rapidity of change within those items outpaces it as well, it does not seem like creating and maintaining such a repository would be less expensive in time or money. Our pleasant conversation becomes much less pleasant when it is suggested that a textbook CMDB is going to cost $150M and will be ready to use productively in just 5 short years.
The good news is that we are not bound by the textbook. Nor are we haunted like the airlines by the specter of falling engines or the reality of righteously zealous regulators (your regulators may not have earned that level of zealotry, but persist nonetheless). Happily, we live in a real world where the only money we are compelled to spend is that which will return a net present value exceeding our investment. Under no circumstance should we invest money or effort in our CMDB that does not meet that condition?
Let me take a moment here to summarize. Nearly every owner I meet believes that their CMDB is the worst (I mean, we can’t all get a trophy). I believe the reason for this is that the textbook has placed upon us unrealistic expectations about the level of detail in the CMDB that is possible or required. I cannot imagine a scenario where the left mouse button, the center mouse button, the right mouse button, the scroll wheel, and the mouse itself are all mapped into the CMDB along with each button’s relationship to the mouse, and the mouse’s relation to the device it controls. The failures of my imagination aside, this is the concept suggested by the textbook. We all fail in the attempt to produce this level of detail. We always will. That should not be a source of shame. In fact, it should not bother us in the slightest.
The real reason that we feel this way is that there is always somebody approaching us with the grievance, “The CMDB is [terrible]” (expletives deleted). Unpleasant as this is, this exclamation is our greatest asset. It allows us to ask the question, “Terrible at what?” The utterer of the curses will invariably and immediately have the source of the complaint at the ready e.g.: Disaster Recovery.
This opens up a very productive line of dialogue if you are in the position to be receiving such grievances. “What do you need to make it work?” The answer is typically as quickly forthcoming, but long. A generalized summation is, that for this class of infrastructure, I need these 15 attributes and these 10 relationships. You may not make it to the end of that diatribe, so you may want to lead with this, “What would you pay to wave a wand and have it work?” You know you know the kind of answers this question gets, “I don’t know, 100 MILLION DOLLARS!” Now we’re just about talking airline money.
This is the first time it’s fun to be you. “Fine, let’s set up a meeting with the infrastructure owners. I’m sure we can get you that. It’ll only take ten.” The truth of it is, that the effort won’t cost more than a bit of process change and communication. In that meeting, the infrastructure owners will say, “I didn’t know you needed that, we can pull that out of discovery.” Worst case, “that’s manual, it will take some time.”
In the course of an hour-long meeting, several positive changes occurred. First, you’re on your way to improved Disaster Recovery (or comparable initiative). Second, and perhaps more importantly, the infrastructure owners have a compelling reason for populating the CMDB. This approach transforms a soul-sucking and impossible task into one where the value to the organization is clear to those doing the work and the value of the CMDB is clear to the people that are paying for it and relying on it.
Smile the next time someone tells you that the CMDB is #%$&@%. It’s money in the bank.
To be continued . . .
The post Overcome CMDB Shame: Part One first appeared on Northcraft Analytics.
The Only Constant is Change
The adage in the industry is that 50% of all incidents are caused by changes. I am equally certain both that figure is low and that it is anecdotal. So few organizations have the tools or processes in place to identify the change occurring, the infrastructure being impacted, or the relationship to the incident that is caused, that their ability to attribute the cause of incident to change can only be supposition.

Cumbersome Process = Blindness
The reason for this gap is certainly not a lack of tools in the marketplace. Change Management is a very well established process, and tools like ServiceNow have that process designed into their core. The reason that Change Management processes are not adhered to as often as Incident Management processes is that they are often overly cumbersome. The bulk of this burden is created by the approval process.
Engineers by personality want to build and are extremely confident in their own technical skills (rightly so). If you ask them to seek approval for the activities that they perform every day, they will start to hide what is going on. Doing the work should take more time than getting approval for the work.
Standard Change is the Goal: Trust but Verify
The key to easing the burden is to establish the goal of moving major categories of changes for groups to a Standard Change. A Standard Change is recorded, but does not require approval. In an ideal scenario, a significant majority of changes should fall into this category. These represent tasks that a group handles every week and has proven reliability in performing.
However, Standard Change classification is a privilege. It must be earned, and it can be taken away. The granularity of this privilege is to a group for a category of changes. For instance, if 30% a database teams tasks involve a recurring restoration task, that DB Restore should be considered for promotion to Standard Change for that group. If there are subsequent Change Failures in the restoration, that category can be demoted back to Normal Change.
The Metric Manual
Percentage of Changes Requiring Approval, Hours Pending Approval, Change Failure Rate, and Implied Change Failure Rate are all key to managing the process above. The goal for the process is to make sure it is lightweight enough that it is adhered to, stringent enough to force collaboration across groups when necessary, and robust enough to provide the information necessary to quickly remedy any impact. The outputs are visibility, quality built earlier into the process, and speed of change.
Data from One Area Informs Another
Link to ServiceNow’s CMDB to gain a 360 degree view of changes to understand the customers, employees, applications, and infrastructure that are impacted. Surface the linkages with the incidents caused by those changes, and the problems that have helped to resolve them. Don’t wait for perfect data – even the lack of linkages creates the urgency to establish functional best practices across teams. Sunlight is the best disinfectant.
Predictive Analytics FTW
Use predictive analytics to provide and automated risk rating for the future schedule of changes. Combine the data from external monitoring systems with the ServiceNow’s ITSM modules to identify the infrastructure will cause you problems – days before it does. Diet and exercise are preferable to a quadruple bypass (for most). Don’t worry, we don’t have to let an expensive data scientist wander around your organization to learn about your data models on your dime. We have been in a long romance with the ServiceNow data model and those of the most commonly held applications. Northcraft shows up day 1 with established models.
Northcraft Analytics can Help
Northcraft Analytics has been working with Global 2000 companies, national governments, and large non-profits for over 15 years. If you’re the champion for management by metrics within your organization and have had difficulty gaining traction or maintaining momentum, we can give you a decade’s worth of metrics and visualizations out of the box on the standard Microsoft tools your organization is already familiar with.
There are few strategic projects in any organization that are not fundamentally IT projects, and none that do not involve IT along the way. IT is in the business of performing magic. Use Northcraft Analytics to help you communicate the full story in the language of business.
The post Change Management in ServiceNow – Trust = Quality + Speed first appeared on Northcraft Analytics.

Understand the game if you want to win

A Day in the Life of the Incident Manager
Competent staff is difficult to find and difficult to keep. Incident volumes vary not just by time of day and day of week, but also by the type of issue. Even within these criteria, there is a natural variation and black swan risk. Getting the right people staffed at the right time is crucial to mitigating the full panoply of risk to the organization: degraded operations, loss of revenue, unavailability of services, and the resulting loss of reputation.

The Metrics that Matter

Mean Time to Resolve (MTTR), First Call Resolution (FCR), and SLA Met percentage are the standards for the output of the process. While averages are important, so are variations by time and standard deviations. If you’re staffing for the average, peaks will overwhelm. It is the manager’s decision to staff for 95% certainty, 99% certainty or 99.999%, but that decision should be informed.
If the output metrics are not meeting your targets, it’s also worth measuring how well the work is being done to identify the areas of improvement. Consider Incidents Incorrectly Assigned, Incidents Incorrectly Categorized, and Incidents Incorrectly Prioritized. These will highlight where improvements in process and automation can be made.
Further decomposed, the automated process will fail if the quality of the data input is substandard. Measuring data quality can highlight needs in training or integration with originating sources. If you can’t see it, you can fix it.
Data from One Area Informs Another
Link to ServiceNow’s CMDB to gain a 360 degree view of incidents and understand the customers, employees, applications, and infrastructure that are impacted. Surface the linkages with the changes that cause those incidents, and the problems that have helped to resolve them. Don’t wait for perfect data – even the lack of linkages creates the urgency to establish functional best practices across teams. Sunlight is the best disinfectant.
Predictive Analytics FTW
Use predictive analytics to alert operational teams to incidents in queue likely to escalate into a Major Incident. Combine the data from external monitoring systems with the ServiceNow’s ITSM modules to identify the infrastructure will cause you problems – days before it does. Diet and exercise are preferable to a quadruple bypass (for most). Don’t worry, we don’t have to let an expensive data scientist wander around your organization to learn about your data models on your dime. We have been in a long romance with the data models of the most commonly held applications and come in with established models.
Northcraft Analytics Can Help
Northcraft Analytics has been working with Global 2000 companies, national governments, and large non-profits for over 15 years. If you’re the champion for management by metrics within your organization and have had difficulty gaining traction or maintaining momentum, we can give you a decade’s worth of metrics and visualizations out of the box on the standard Microsoft tools your organization is already familiar with.
There are few strategic projects in any organization that are not fundamentally IT projects, and none that do not involve IT along the way. IT is in the business of performing magic. Use Northcraft Analytics to help you communicate the full story in the language of business.
The post Incident Management in ServiceNow – It’s not Just About Service, It’s About Risk first appeared on Northcraft Analytics.
There are few management concepts that are as powerful and as misused as the Balanced Scorecard. Properly used, it can be both a tool for management to measure progress toward the achievement of strategic goals as well as a means to communicate the organizational strategy to the people doing the work. Sounds great! So, why is this so often a mishmash of irrelevant numbers that seem to add to the confusion?
Overview: Balanced Scorecards for IT Organizations
There are three big reasons for this. First of all, the Balanced Scorecard (which we will call BS going forward because that’s hilarious) has a structure, and that structure was defined by two really smart guys, Kaplan and Norton. Because the name is so intuitive, most people think, “I get it” and start building without ever having grasped the purpose of the scorecard in the first place. We will discuss the BS structure as it relates to IT in case you don’t feel like clicking that link and reading the original.
The second reason is that for a BS to be effective, it has to be linked to organizational or departmental strategy. First of all, that means that management needs to be able to clearly state what the strategy is. Though that shouldn’t be a common barrier, let me just mention humbly that it is an unavoidable prerequisite, and we will discuss a few ways to lead the department to water. Linking the metrics to measure the progress toward achieving that strategy is an extremely valuable exercise for management, but it is impossible if that strategy is not clearly stated, and in the end, nobody can do it for you.
Finally, we have the drunk looking for his keys by the light post, because that’s where the light is best. Scorecard builders often include the metrics they have rather than the metrics they need. In this metaphor, the drunk’s keys are business value, and the lamp post is the data you already have.
There’s always a tradeoff between the cost of gathering data and the value that data provides, but when it comes to strategic-level data, it’s almost always worth making the investment. At a minimum, it’s worth including the metrics missing data on the scorecard to prioritize the data gathering effort. Integrating the data is no longer the issue it was 5 years ago given the current data visualization technologies available. If integration is the alleged roadblock, give us a call immediately.
Integrating Metrics with Strategy
In order for a BS to be effective, there needs to be a clear statement of strategic intent, and the metrics on the scorecard need to measure the progress toward the goal stated or measure the capability to achieve that goal in the future. That’s relatively straightforward for a product-oriented firm with a profitability bottom line. There are some twists and turns for not-for-profit organizations, educational institutions, and support departments which we will discuss below.
Strategy and Support Departments
The Boston Consulting Group (BCG) states pretty emphatically that strategy can only be defined for a business unit. Basically, if the entity you are measuring has a dollars and cents bottom line, then the strategy can be formulated meaningfully – otherwise, you’re just talking nonsense. That definition doesn’t fit the IT function that well, and I’m not going to do a bunch of hand waving about transfer pricing (though I have been a cost accountant in a previous life – long live Activity Based Costing!).
Never say never. BCG never saw a 2X2 matrix they didn’t love. Let’s not let them have the final word. Can a meaningful statement of strategic intent be formulated for a support department? In truth, that is a topic for an article in itself, but let’s discuss high level.
On the surface, there are two ways to go about it. One direction is to state definitively that IT’s strategic purpose is to support the strategic initiatives for one-to-many business units in the organization. To operate this way, IT must be included as a part of the strategic planning process for the organization (ideally it always should be). In some specialized cases, IT should be leading it.
Statement of Strategic Intent
The other option is to define a statement of strategic intent for IT as a whole. It’s worth stating a few examples so we can get the gist of what that would look like.
- Komatsu – Encircle Caterpillar
- Coca-Cola – should always be within arm’s reach of desire
- Apollo – Put a man on the moon before the Soviets
These are all bangers, and like most successful ones, they have these three components:
- Capture the essence of winning
- Stable over time
- Set a target that deserves personal effort and commitment
Now it’s tough to write a hit song, but I have good news for you. There are a few fundamental components that comprise the strategic purpose of every IT department, but the priority will differ depending on the type of organization:
- Develop new features and capabilities
- Provide a stable environment for existing capabilities
- Secure information without diminishing its utility
Depending on the organization, each of these elements may be emphasized more or less in the statement of strategic intent.
For Example:
Consumer Bank – Provide our customers access to their money more quickly and safely than cash in their own wallets.
Software Company: Half of the revenue will come from features developed in the past 2 years.
See, I just made those up (well, I kind of cribbed Coca-Cola and 3M respectively). Feel free to use those if you want, you’ve made it this far in the article. We’ll go deeper into Strategic Intent for IT in a future article, but that’s probably enough to get started on Balanced Scorecards.
Balanced Scorecard Structure
Now I don’t get emotional very often, but my eyes welled up a bit when I understood how elegant the structure of the Balanced Scorecard really is – especially considering the name is so unbelievably milquetoast. There are four categories of measures in a BS, aka Perspectives, from which to view the achievement of strategic success:
- Financial Perspective
- Internal Business Perspective
- Customer Perspective
- Innovation and Learning Perspective
We’ll get into the detail of each, but the elegance is that these compass points, properly used, force a holistic view of the organization. There are leading and lagging indicators, hard and soft evaluations, and evaluations of long and short-term success. There is a reason this tool has outlived forty years of management fads.
Financial Perspective
Sounds intuitive. This used to be the only perspective in evaluating organizational success. Note also that these metrics are typically lagging. The traditional metrics were intended as a report to shareholders:
- Market Capitalization
- Net Profit
- ROI
These metrics, while appropriate for a profit-making entity, obscure the real purpose of the compass point. These metrics are supposed to be the ones measuring success from the outside. There’s no arguing with cash, as it were. We actually made a profit last quarter. That’s a big deal, but it might not be the whole story.
Suppose we were an auto manufacturer having turned in the highest quarterly profit number in our 100-year history. Imagine also that our time to produce an equivalent vehicle had increased 25%, a number worse than all of our competitors. We also experienced a part defect rate 31% higher this quarter, the customer satisfaction rating with our dealers has plummeted, and we lost our two top designers. Is that a good quarter? In a shallow sense, Yes but holistically very much No. With these metrics, however, I do have a more sophisticated view of the organization than I would if I had only the financial perspective.
How does this translate to IT? We do not cram in pure financial measures just because that’s the title of the compass point. If this were the space program, the metrics would be the number of days ahead of the Soviets, last milestone, average per milestone, current milestone, and man on the moon. There isn’t a single dollar there.
To make this transformation, we look back to our statement of strategic intent. If we are supporting our organization, we look at the success of the initiatives we are supporting. If we have stated strategic intent for IT independently, then we ask ourselves – did we achieve success as we have defined it?
Consumer bank (as per above):
- Average Speed of Transaction
- % Transactions completed successfully
- % Identities Compromised
Both the number and the trend are important here, and perhaps a goal for the time period. If the numbers here are in decline, then IT had darn well better have ongoing initiatives to drive improvement.
Internal Business Perspective
The remaining perspectives require no similar transformation. The Internal Business Perspective simply asks: Are we executing on the operations that enable us to improve the metrics defined in the financial perspective? These metrics tend to be real-time or very slightly lagging.
For IT, typical metrics include:
- Mean Time to Resolve
- % Changes Completed Successfully
- Application Availability
Again, the metrics chosen should align with the statement of strategic intent and will evolve as processes mature and the initiatives undertook progress.
Customer Perspective
If customers don’t recognize the value of the services we provide, they will stop spending money on them. This makes just as much sense for an internal support department as it does for a services firm. In IT we must be very clear about who our customers are and make sure that they are declaring openly that they find significant value in partnering with us.
Metrics that evaluate performance from the Customer Perspective tend to be leading indicators. If our customers are having a good year, our next year is likely to be good. Typical metrics for IT include:
Innovation and Learning Perspective
This perspective tends to be the least evolved but considers important. This is asking the organization – are we doing the things today
that will enable us to succeed in the foreseeable future?
These are the foundation-building activities that tend to cease when not recognized. By putting these activities on the front page of a scorecard, their fundamental importance is duly recognized. This is especially important for a support department, as the foundation that is laid is extremely valuable, and unless recognized, executives may subscribe to the illusion of frictionless transition to outsourcing.
Typical metrics for IT include:
- % Incidents Using Knowledge Article in Resolution
- Training as % of Salary
- % Increase in Stock of Knowledge Articles Used > 10 Times
Discourse on Style
One thing that may become apparent when considering what metrics are relevant, even when measuring for a single function like IT, is that there are an enormous number of metrics that have previously been used to govern operations that are candidates for the scorecard – far too many to include at the executive level.
There are two ways to handle this. The first is to select representative metrics that communicate the progress toward organizational goals particularly well. This requires a real understanding of the goals, the operational activities under evaluation, the purpose of the perspectives, and fluency with the data being produced. A consultant can help with the process, but internal management needs to be actively involved in the selection.
Alternately, the breadth of individual metrics can be aggregated into an overall measure with any manner of weighting or calculation. These often appear as health metrics on a dashboard and are typically called Composite Metrics in the literature. Examples of IT would be Incident Management Health, Network Health, Cloud Health, etc. Composite metrics that are properly constructed will resonate with organization goals better than representative metrics. However, a composite metric loses the immediacy and the mandate to improve. For example, what is a Cloud Health score of 8 and how can I improve it? Those are answerable questions, but there is an intermediate step that can blunt the impact somewhat.
There is no wrong answer. I’ve seen both approaches work effectively across a range of industries and types of organizations. The choice just needs to fit your organization’s management and strategy. If there is consensus on those two items, you’ve made a good choice.
Discourse on Method
When the Balanced Scorecard was originally implemented, data was gathered from a variety of sources by hand and the results were either written for the time period or stored in spreadsheets as an aggregate answer. The metaphor was that the metrics on the BS are like the gauges in a cockpit for an executive piloting the organization. Only the gauges were really slow and would provide feedback once a quarter.
We can torture that metaphor a bit with modern technology. First of all, systems integration and data warehousing should eliminate any manual process involved. The benefits here may be obvious, but let’s put them in bullet points as they are particularly significant.
- Elimination of manual error
- Increased objectivity
- Increased timeliness of data
- Increased granularity
Here’s where the cockpit metaphor breaks down. A fuel gauge will tell you how much fuel you currently have, but it won’t tell you the trend, it won’t tell you what the fuel level is on every plane in the fleet or what the burn is related to altitude, engine type, air temperature, speed, or any number of operational attributes that may help to diagnose overall performance. These relate to granularity – the ability to slice, dice, and aggregate observations down to the moment and the object observed.
Additionally, the improvement in visualization tools enables the ability to touch a metric and access all views of the data previously considered relevant (standard reports) as well as a capability to query the granular information to answer new questions raised by unexpected results (ad hoc reporting/analytics).
Properly constructed, a Balanced Scorecard is a portal into the strategic issues facing the organization with the capability of identifying the root causes of exceptional performance.
Conclusion
The Balanced Scorecard is a lot like the movie Highlander. It’s been a classic for decades, and there’s never been a compelling sequel. It also looks a lot better on modern technology – think Blu-Ray vs. VHS. Perhaps this approach can revitalize your department like Highlander reinvigorated careers of Sean Connery and Queen.
We’ve also established here that strategy is meaningful for the IT function, and that the Balanced Scorecard approach is a powerful tool in providing leadership and practitioners a holistic view of the collective progress toward achieving strategic goals. Perhaps the only warning is that knowledge is power, and some may handle that better than others. It’s quite a rush.
If you need an experienced partner to assist with any of the processes or technology, click any of the pictures in the article to schedule a meeting with Northcraft Analytics, and perhaps we can quicken the effort.
The post Balanced Scorecards for the IT Organization first appeared on Northcraft Analytics.
It would be better if Augustus were never born or if he had lived forever. – Suetonius
Pessimists are usually right, but optimists change the world. –Inspirational calendar (August)
Visions of the Future When Establishing Analytical Culture:
Star Wars v. Star Trek
Let us briefly set aside our differences and discuss our space epics dispassionately. Star Wars and Star Trek have two of the most devoted fan bases, and while they may wish each other well, it is unusual to find fans devoted to both. Both have spaceships, alien races, and novel technology. However, the two franchises have a starkly different vision of the future (and don’t give me that “a long time ago business” – they have spaceships, technologically, it’s the future).
Star Trek – Idealism
Star Trek is fundamentally idealistic about the future. Humans have established gender equality, eliminate racism, and established as their Prime Directive a mandate for non-interference, mitigating the potential for the evils of colonialism (though this is typically violated for the flimsiest of pretenses). Technology in this universe is transformational and uplifting. Faster than light travel has established the capability for exploration and discovery. The replicator has ended any concept of hunger or physical scarcity and established instantaneous point-to-point travel. The conflict has certainly not been eliminated, but the struggles are typically between that of elevated humanity against a life-form at a different level of evolution, a culture with radically different values, or a throwback human rebelling against the greater good of all with selfish individuality – the last are typically punished or killed.
Star Wars – Decline and Fall of the Empire
Star Wars is essentially pessimistic about the future. There are lasers and spaceships, but the quality of life looks no better than now and perhaps worse. Any recognizable civilization is either a crumbling façade of a forgotten city-state, or a vast autocracy primed to eradicate individuality. The humans and aliens seem to have established hatred toward each other, but we’re just not familiar with what the races are. Technology is typically used to kill and does not even receive the hand-waving explanations in Star Trek. We are really meant to receive these advances as magic rather than the accretion of incremental progress over time. The future looks a lot like today and doesn’t provide any New Hope that civilization will get substantially better – smiling ghosts and teddy bears notwithstanding.
What Does it Matter?
It turns out this is a bedrock issue for managers. Do we fundamentally believe that large organizations can be forces for transformational improvement as they are in Star Trek, or do we espouse the Star Wars belief that the nature of crowds and power leave large organizations fundamentally corrupt or malevolent, rendering long-term improvement unachievable, the sole provenance of a force-infused rogue change agent?
This is already an emotionally charged subject, so let’s disentangle the love of the franchises from the implied worldview. On a personal level, I lean toward Star Wars and become even more biased if I forfeit Wrath of Khan on the basis that it is essentially a Star Wars-style movie with Star Trek characters (Spock forgive me). I might also admit that the Decline and Fall motifs of Star Wars feel increasingly realistic.
However, I am not a Jedi, I don’t know any Jedi, and I am unlikely to become a Jedi. I am but a lowly executive with above-average math SAT and a penchant for breaking things. The future that I choose to devote my efforts to is that consistent incremental positive change to affect long-term transformation. Does that make me a Trekkie – perhaps in an adult sense? Can any of us in the practice of technology, business, law, or medicine ethically choose differently?
Note: one may choose this path and still skip Star Trek V.
The Truth is Out There
I have been spoiled by a charmed career. I have seen the analytical promised land. Confusingly, this was during my first adult job, and I didn’t appreciate how rare the situation was. I thought every company based decisions on relevant data supporting plausible business cases. When I got into consulting and got to see a broad range of companies, I quickly found that this was a capability far more often sought than held. An analytical culture is a powerful but fragile resource that must be seeded, nurtured, and preserved. While it exists, the organization can perform magic, and it’s a great place to work.
American Airlines – A Remembrance of Things Past
 I graduated college in a recession, which was both a blessing and a curse. The lack of opportunity gave me an unwelcome period of reflection to properly consider what I wanted to do. In college, I had been greatly attracted to finance because some relatively simple math could be used to frame billion-dollar, multi-year decisions in black and white. I had also never left the country. Twenty-two-year-old me considered that a finance position in the airlines would kill both the insignificance and cultural ignorance birds with a single stone.
That may have been the one and only time that I had a plan for a big decision and it came off. As a result of a recession, American Airlines had cut recruiting salaries and for the first time, they opened the door to hiring undergraduates into corporate finance. When I got the opportunity to interview, I had coincidently been thinking of nothing else and devoted myself to preparation maniacally. That and the limitation of alcohol intake during the sponsored welcome dinner proved to be a decisive advantage against the competing 22-year-old candidates.
My luck held though it took me a few months to realize it. I was placed in a group tasked with calculating the profitability of every passenger flight. This information was used to set schedules for the airline and served as the primary topic of monthly meetings at the executive level. The inputs to these calculations were ticket revenue on one side and the general ledger line items categorized into cost pools. The pools of cost were then allocated to individual flights based on operational systems monitoring flight statistics, fuel burn, pilot scheduling, etc.
On one hand, this was overwhelming, but on the other, it was an opportunity to put to use the statistics, accounting, and finance that I had long despaired of having a practical application. There was so much data available. All you had to do was get it and come up with an idea for how to use it. At that age and level of experience, I could do neither.
Leadership is Important
Fortunately, I had an incredible manager in David Roberts. He was a Kellogg MBA and a Cornell Masters of Engineering, an intimidating brain to say the least. However, he also had the generosity that is only available to those accustomed to being the smartest guy in the room. He pushed me to learn to code as a secret weapon. Being able to use that skill to access data got me on a lot of projects nobody my age should have been close to.
Data can do Anything

I also got to enjoy the company of MBAs from top programs, and they introduced me to libraries of theory in statistics, finance, and managerial accounting. Rich Coskey was a newly minted Cornell MBA that taught me that you could pull any of these theories off the shelf and code them into financial models to drive radically different decisions. You shift a couple of parentheses around, and hub-and-spoke scheduling doesn’t look like quite the positive innovation previously thought.
The point is, that I’m idealistic because I’ve seen the ideal. The two people I mention above stand for hundreds that I had the opportunity to work with. Out of every team of four, there was typically one person that could code, and all of them were pros in Excel. That meant for any significant project being considered, the profit impact could be evaluated. Operations were driven by real-time data and historical models, and performance was reviewed across multiple perspectives with consolidated data. New opportunities for optimization were sought and taken. That was the job description.
What does it look like?
American Airlines was the first company that I got to see from the inside, and naïvely, I thought all companies were like that. After working with hundreds of clients, I have a significant appreciation for how rare and fragile an analytical culture really is. It doesn’t have to do with industry, the age of the company, or geography—airlines have been around for a century; this one headquartered in Irving, Texas just happened to invent real-time computing. An analytical culture is something that must be painstakingly built and actively preserved. The rewards, however, are vast.
People are the Competitive Advantage
Every business is a talent business, it’s just a matter of degree. Consider the best bricklayer in the world. He can build four walls at the same time that a merely competent colleague can build one. In basic masonry, that person is in the hall of fame. In technology, however, one incredible person can do the work of hundreds, if not thousands, of moderately talented technicians. Are they harder to get? Sure. 100 times as hard? Probably not. Is your business more like masonry or technology? If it’s anywhere closer to the latter, you’ll never regret the investment you make in top talent.
That investment can be significant, and it’s not just sallies and bennies, though those must be competitive. Are you aware of the pipelines for talent for each of your functional areas? Do you have any relationships with them? Are there university programs for the fields you’re hiring? Do you make recruiting trips? Is your interviewing process rigorous and unbiased? Do you review the results? Do you encourage/mandate employees to move functions every 12-18 months? Is there a clear career progression? Do you have a mentor program? Executive development? Incentive and stretch goals/bonuses? Sabbaticals to prevent burnout? Each of these is an investment of time and/or money, and they’re critical to finding and keeping top talent. More importantly, these measures help to ensure that top talent makes it to the executive suite and populates the VP, director, and manager layers with rock stars.
Analytics is a Process
So, let’s assume you’ve done what you need to do to get great people. I’ve been in several organizations where the dream team was assembled, but let’s just say they didn’t always win gold. Culture is key, and it is a fragile thing. Here are a few elements that are pretty closely correlated with success.
Coding is Cool
Coding is a skill, not a job. Whether you’re in finance, marketing, or operations, the skills that you build up in college are enough to marshal data into better decisions. Getting or manipulating the data might require a bit of coding. Anyone that can write an Excel formula can write SQL. Unfortunately, most business programs teach the former but not the latter. Make these young whippersnappers get their hands dirty. It will teach them about the systems that run the organization and about the oceans of data ready to be mined. Not everyone will take to it, somewhere between 1-in-5 to 1-in-3. That’s ok. Not every marketing planning director needs to write stored procedures – but one person on a team that knows how to automate targeted campaigns based on customer data turns out to be a pretty good complement to the creatives. Consider what the organization looks like when every team in every function has someone like that.
Arguing is Cool
Arguing doesn’t mean you hate each other. If two or more people have different approaches to a project, that is gold. If the culture is such that the best business case carries the day, and the data to support that case is available to those in conflict, those arguments are the true work of the management layer. I have walked away from multiple arguments like those having lost and feeling better about the direction of the next few months. I have been in many polite discussions unsupported by data on either side where my blood pressure remained low but saw good projects crumble like sand.
Comfortable is not Cool – Move Around
Every new job is terrifying. It takes several months to learn enough about the function to make a real contribution, and it can be frustrating to leave a job right when you start to see that value. However, let’s say the target is to promote to manager in 3-5 years.
Which resume would you rather see:
- Five years of budget planning
- Contributory roles in finance, marketing, and operations with an understanding of the underlying technology in each function
Easy hire. Imagine that you have 10-100 people with the same resume within your organization applying for the position. Recruiting for opening positions was brutal, but the bench for managerial talent gets deep quickly.
There are a fair number of knock-on benefits. When managers have experience in multiple functions, they know who to collaborate with to complete multi-disciplinary projects (i.e., anything worth doing). You also have an army of managers that feel confident they can walk into any room and save a million bucks. Remember that bricklayer? There’s also something satisfying when the room one of your rock stars walks into has four more people with the same results orientation but different skill sets. Where else are they going to get that? Hey, we have a culture going on here.
Technology is the Force Multiplier
Technology is a funny thing. My first job that a sober adult would intentionally seek was on a team of four, sometimes five people. At one time, that team was a department of 500 very smart people. They had the same task we had, calculating the profitability of every flight and producing a digest of that analysis, only they did it without the use of spreadsheets or any sort of modern automation. Thanks to Excel, SAS, and the APL heroics of Tina Lattanzio, we got to take an hour for lunch and breaks for sheet cake on departmental birthdays. Most of our time was spent on how to improve the theory and process, i.e., value-added work (not to mention fun). Note: APL = a Programming Language . . . seriously.
The output of that process was the Flight Profitability Review, and it was cooler to carry around than a Blackberry in the year 2000 (ahem, analytics as a culture – early 90s style). It meant you were invited to a meeting with CXOs to promote/defend your performance.
Note: While cool and career-benefitting, attendance was not always pleasant, as the CEO was perpetually attempting to quit smoking and occasionally threatened those without ready explanation with cardiac impalement by nearby writing utensils.
In one form or another, this was de rigueur. In yield management, every team leader knew their markets by the week and had ample notice of event-driven tidal waves of demand. The concept of an AI-driven organization is in current parlance; I can vouch for seeing one in full-blown operation in 1995, and it may have been a decade old then. In maintenance operations, every bolt turned by every mechanic was tracked and maintenance schedules were optimized and shuffled to the latest bulletin. Underpinning all of this was an ocean of data, the largest non-military computer in the world, and a management class ready and able to use that data to improve operations and decision-making.
It didn’t matter what department or function; that was the expected operating mode. If you didn’t have data on your side, people would look at your askance. One would call it an analytical culture. The result of all of this is that a know-nothing 22-year-old was expected to produce the same value as 100 experienced analysts. With that technology, that culture, and those people, that was a Wednesday.
Conclusion
People without the culture or the technology are not enough. “A” players want to make their impact and they want to play with other “A”‘s, and if they can’t do something big at your organization, they will do it elsewhere. Technology without quality people or an analytical culture is not enough. Data does not act, is not shared, and certainly doesn’t organize itself into subsystems to optimize operations, though it may be a foundation to build a team on.
The culture by itself is just the C-suite’s vision of the future. When that vision is a continuation of the wrong people, broken processes, and inadequate technology, it will turn out to be accurate. When it’s optimistic, it can drive the commitment to build the team and give them the tools for success. That too tends to be a self-fulfilling prophecy.
Northcraft Analytics was born out of a desire to provide the tools required to foster an analytical culture within the IT organization. Too often, technologists are tasked with providing analytical capabilities for a line of business functions and receive a little budget for bringing those capabilities to their function. Using Northcraft Analytics to underpin a killer team with a supportive executive vision enables an organization to boldly go to the future of its own choosing.
Post Script
You may ask yourself; didn’t all of those airlines go bankrupt? All of the majors were in and out of bankruptcy after the deregulation in 1978 except American. America lasted from 1926 to 2011 and was finally pressured into bankruptcy by the reduced cost structures of the recently bankrupted and consolidated majors. Along the way, they invented Real-Time Computing (1960), and Yield Management (1979), a frankly superior pre-cursor to ARPANET/Internet (SABRE). The talent from America spread out across corporate America, including the C-Suite of AT&T, FedEx, Delta Air Lines, and Hawaiian, and those are just people I knew personally. AA alumni, please chime in in the comments to augment the list. An excellent book on the industry history is Hard Landing.
The post Establishing an Analytical Culture – Choose Your Future first appeared on Northcraft Analytics.


 Sit back, relax and enjoy today’s brand new episode in our ServiceNow series of The Alldus Podcast as host